5
Thermo Scientific Poster Note
•
BioPharma_PN63945
_E 11/13S
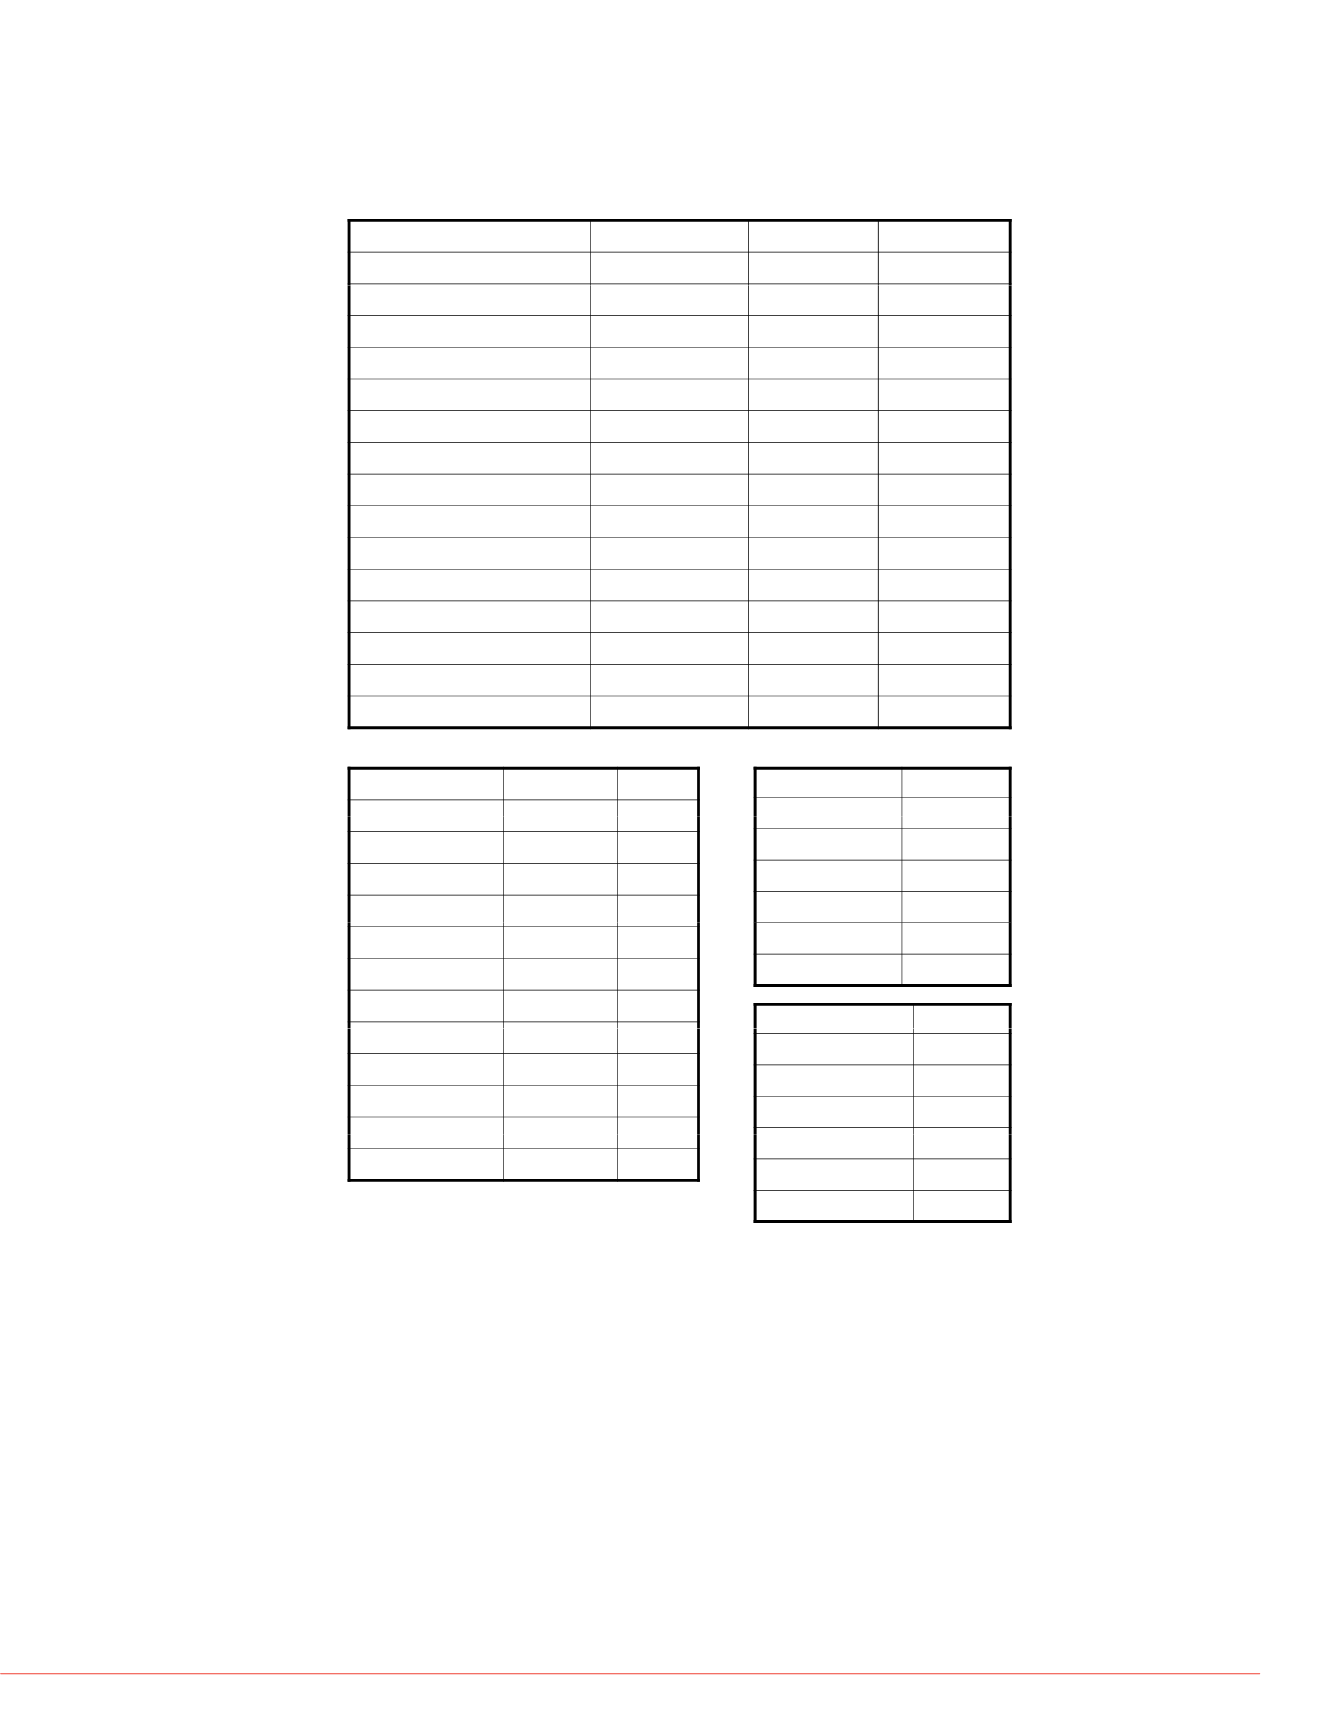
Figure 4. Identification and localizat
peptide 136-LGLGNHNYCR-145. Ba
spectra (B) of this peptide in native
lycoforms % glycosylation
Table 2. Comparison of glycoforms in the three samples. Only those with relative
abundance higher than 1% in at least one of the samples are included.
Abbreviations for glycan structure (1) : Antenna A, core fucose (Fuc) F, mannose
(Man) M
,
galactose (Gal) G,
N-acetyl neuraminic acid (NANA) S, N-glycolyl
neuraminc acid (NGNA) Sg.
of glycosylation and the
ce.
A
N448 Glycoform
TPA
I-TNK
G-TNK
N448+A2G2F
6.41%
5.40%
3.23%
18
>99
11
>99
14
>99
12
19
A
N448+A2S1G0
5.18%
2.57%
ND
N448+A2S1G0F
0.52%
0.21%
1.79%
N448+A2S1G1F
23.11%
16.86%
14.43%
N448 A2S2F
37 96%
35 34%
37 59%
44
>99
36
>99
47
>99
b4++
b2
150
200
250
300
350
400
110.1
143.1 171.1
b4++
b2
y1
335.1
y2
y8[3+]
375.2
y5++
401.9
M[3+]
+
.
.
.
N448+A3G3F
0.59%
1.29%
0.80%
N448+A2Sg1S1F
1.32%
0.70%
0.56%
N448+A3S1G2F
1.59%
2.48%
0.91%
copeptides. A: glycosylation
n on N103.
B
150
200
250
300
350
400
143.1
171.1
y1
310.1 335.1
y2
y8[3+]
375.2
y5++
402.2
M[3+]
4
y6-
N448+A3S2G0
1.43%
0.86%
0.57%
N448+A3S2G1F
5.19%
7.00%
5.04%
N448+A4S2G2F
0.98%
ND
2.20%
ALAQK-122
150
200
250
300
350
400
110.1
143.1
171.1
b4++
b2
y1
y2
345.5
y8[3+]
b7++
375.7
y5++
402.2
M[3+]
N448+A4S1G3F
0.39%
1.16%
0.56%
N448+A3S3F
9.33%
11.61%
16.50%
N448+A4S3G1F
1.17%
6.55%
2.62%
N448+A4S4F
1 67%
7 20%
6 51%
1600
1700
1800
1900
2000
2100
2200
M[3+]
1611.2
Y1++
1712.7
Y2++
1793.8
M1++
1874.8
M2++
1955.4
M3++
2036.8
M4++
2117.3
M5++
Table 3. Identified deamidation
N103 Glycoform I-TNK G-TNK
N103+A2G0F
ND
1 61%
N117 Glycoform TPA
N117+A1G1M5
3 57%
.
.
.
B
C
Location of N-deamidation
N140
N142
R-449
.
N103+A2G1F
0.27% 4.49%
N103+A2G1M4F
ND
27.99%
N103+A2S1G0F
ND
1.72%
.
N117+A1S1M4
2.63%
N117+A1S1M5
6.74%
N117+M5
52.41%
N205
N218
N234
N37
N103+A2G2
2.36%
ND
N103+A2G2F
14.89%
ND
N103+A2S1G1
5.82% 1.91%
N117+M6
28.46%
N117+M7
6.00%
N 184 Glycoform I-TNK
D
N370
N454
N469
SALAQKPYSGR-129
1500
1600
1700
1800
1900
2000
2100
2200
++
1477.7
Y1
M2F
2166.9
M3F
N103+A2S1G1F
41.74% 51.76%
N103+A2S2
3.15%
ND
N103+A2S2F
26.09% 9.94%
N103+A3S1G2F
2 19% 1 89%
N184+A2S1G1F
3.22%
N184+A2S2F
4.74%
N184+A3S2G1F
2.01%
N486
N516
N524
1697.7
Y1++
A1G1M2++
2143.4
A1G1M2F++
A1G1++
Conclusion
An LC-MS/MS workflow was develope
biosimilar and reference products. Thi
of a biosimilar to a reference product.
.
.
N103+A3S2G1F
2.16% 1.08%
N184+A3S3F
2.99%
N184+A4S3G1F
1.50%
N184+A4S4F
1.67%
dance in the three samples were
1600
1700
1800
1900
2000
2100
2200
3+]
2[3+]
1557.0
A2G2[3+]
1624.7
Y1-F++
1697.7
Y1++
Y2++
M2++ M2F++
A1G1M2++
2143.4
A1G1M2F++
A1G1++
2224.9
A1G1F++
1650
1700
1750
1800
1850
1900
1950
2000
2050
2100
2150
1654.0
1798.8
Y2++
1887.8
M2++
1961.3
M2F++
2041.8
2070.3
1. 100% sequence coverage was obta
magnitude dynamic range for identif
2. The identified covalent modification
deamidation, overalkyation, Cys+D
the modified forms was calculated a
undance are consistent among
on this site contain sialic acid.
nd G-TNK while the relative
3. Other covalent modifications identified and quantified
Besides glycosylation, other covalent modifications that were indentified in these three
samples included cysteine alkylation, deamidation, overalkyation, Cys+DTT, oxidation,
formylation, glycation, etc. Also identified are low abundance semi-tryptic and non tryptic
peptides (data not shown).
3. The site and type of glycosylation w
calculated. Comparison of glycosyla
indicates the differences in glycosyl
,
ost abundant form, A2S1G1F
,
e third most abundant forms are
ly two of them were shared in
hi h i
l t l diff
t
Figure 4 shows an example of a peptide that was identified in 3 different forms: native and
deamidated on two different Asp residues, respectively. A total of 12 deamidation sites were
indentified with high confidence in the three samples. Deamidation on N140 was only
identified in I-TNK and G-TNK, not in TPA. Other sites and relative abundance of N-
d id ti
i t t
ll th
l
(T bl 3)
References
, w c s comp e e y eren
).
(Table 2D) and all of the
eam a on were cons s en across a ree samp es a e .
All trademarks are the property of Thermo Fisher
these products in any manners that might infringe
1. Zhang Z, Shah B. Prediction of Col
Glycopeptides for Glycoform Identifi


