3
Thermo Scientific Poster Note
•
BioPharma_PN63945
_E 11/13S
w for the analysis of the protein
products using a Thermo
rbitrap mass spectrometer
Results
Nine LC-MS/MS data files, three repeat runs for each of the samples: TPA, I-TANK
and G-TANK, were analyzed and the results were compared.
Site of glycosylation
Table 1. Identified glycosylation
number of glycoforms identified
.
ion dissociation (HCD) method
-top mass spectrometer. Data
lopment.
ifferentiating minor differences of
1. Peptide identification and protein sequence coverage
The top ten data-dependent acquisition using the Q Exactive MS produced high quality,
high-resolution and accurate mass MS/MS spectra which yielded high rates of
identification. For each raw file, 40% to 50% of the MS/MS spectra resulted in high
confidence peptide identification (data not shown). 100% protein sequence coverage
N 103
N 103
N117
N 184
ducts using a benchtop Orbitrap
ent. This workflow provides
uct comparison.
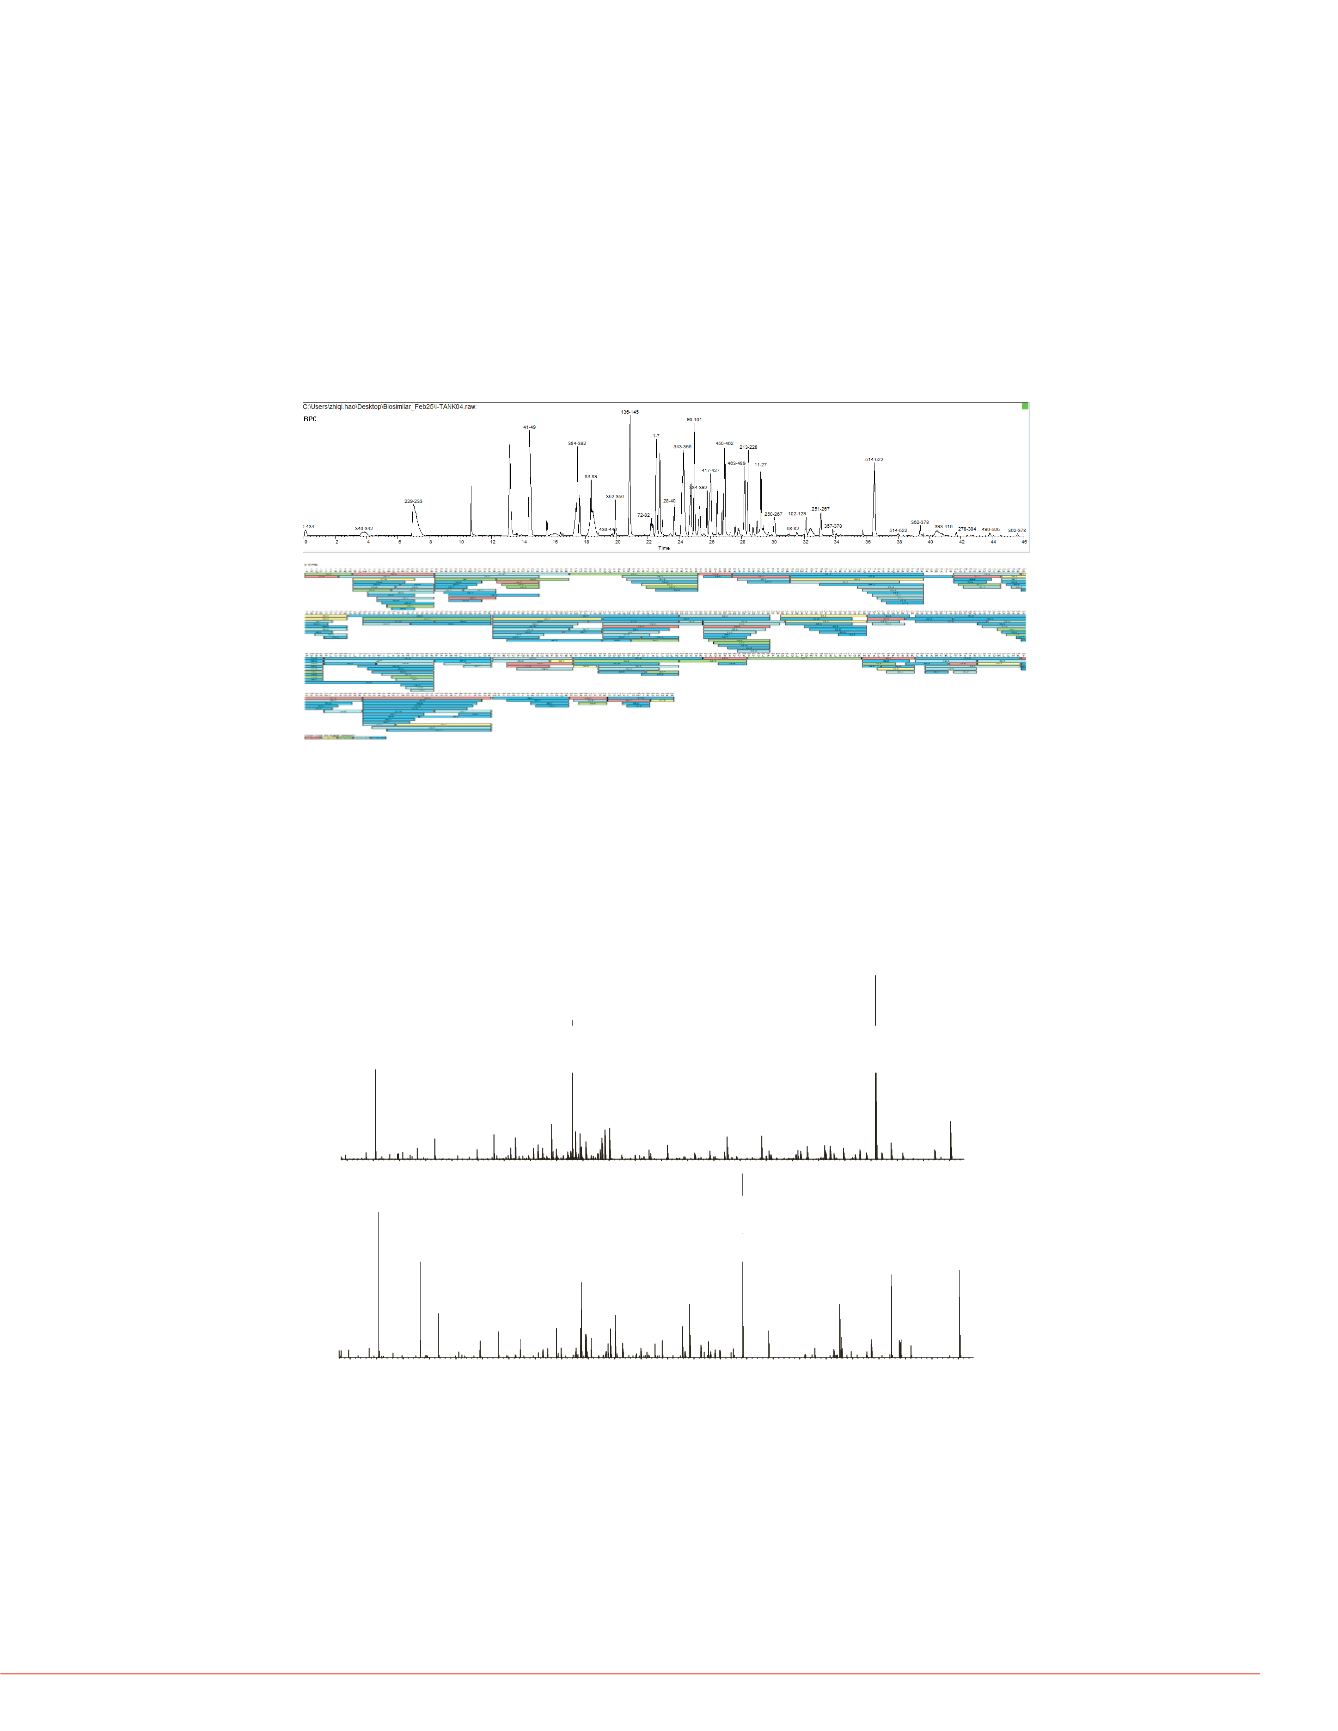
was achieved for each of the nine data files. Figure 1 shows an example of the peptide
map and sequence coverage view for one of the data file.
Figure 1. Peptide map (top) and sequence coverage (bottom) of I-TNK.
N 448
N 448
N 448
ies to have appropriate and
e biologic product. Mass
lore the similarity and difference
ic. In this study, we developed a
Figure 3. Examples of HCD spect
on N117. B: glycosylation on N44
366.1
(GGn)
nd reference products. Any
lation can be well characterized
Orbitrap LC-MS/MS with a
s.
generic variant of TPA (TNK)
A
138.1
168.1
204.1
(Gn)
102-GTWSTAE
ition, two TNK forms (G-TNK as
e also compared to explore the
200
300
400
500
600
700
800
900
(G)
(M3)[3+]
(M)
186.1
b7++
528.2
(GGnM)
690.2
(Bn)++
ing trypsin after reduction and
ith the following minor
The Q Exactive MS provides very high throughput and sensitivity. More than 5 orders
of magnitude of abundances of identified peptides was routinely achieved (data not
shown) which ensures confident identification of low abundance modifications non
B
204.1
(Gn)
(Gn)
274.1
(SGGnM)[3+]
366.1
(GGn)
,
,
specific cleavage versions as well as sequence variants. Figure 2 shows the high
quality MS/MS spectra of a peptide (top) and its double oxidized (on W) version
(bottom) which is of 0.1% in abundance.
Figure 2. MS/MS spectra of a peptide (top) and its double oxidized version
168.1
186.1
292.1
(S)
657.2
(SGGn)
SY-Spray™ technology
a Thermo Scientific™ EASY-
olvent A) and 0.1% formic acid
60 min gradient was used to
579.8
y10++
1158.6
y10
(bottom) which is of 0.13% in abundance.
366.1
(GGn)
102-G
N
WSTAE
200
300
400
500
600
700
800
256.1
454.2
(SG)
528.2
(GGnM)
Y1-F++
(Bn-1)-SGGnM
Y1++
767.9
Y2-F++
Y2++
848.9
M1++
(Bn
A
iation (HCD) method was
S system to analyze the
used: MS scan range 100-2000
C
204.1
y2
540.2
651.3
b13++
1301.6
b13
190-GTHSLTESGAS
C
LPWNSMILIGK-212
138.1
168.1
204.1
(Gn)
(Gn)
274.1
(SGGnM)[3+]
292.1
(S)
657.2
(SGGn)
1083.5
Y1-F[3+]
(Bn-1)++
1106.6
y20++
00 with AGC target of 1x10
6
.
AGC target of 2x10
5
. The spray
S-lens level was set at 55.
The type of glycosylation forms and
150
200
250
300
350
400
450
500
550
600
650
700
750
800
850
900
950
1000
1050
1100
1150
1200
1250
1300
m/z
147.1
y1
y4++
256.1
284.1
317.2
y3
b4
398.2
b8-H2O++
430.3
y4
b9++
471.2
b10++
y12[3+]b5
514.7
b11++
y14[3+]
y5
y15[3+]
y16[3+]
b12++
b6
y11++
674.4
y6
699.8
b14++
y12++
726.3
b7
761.5
y7
b15++ y14
813.4
b8
842.4
b9
875.5
y8
b17++
941.4
b10
b18++
1010.5
b11-H2O
b19++
1028.5
b11
1061.6
y9
b20++
1097.5 1129.0
b21++
1188.5
b12
1210.6
1271.7
y11
204.1
y2
282.1
891.5
b17-2H2O++
190-GTHSLTESGAS
C
LP
W
NSMILIGK-212,
200
300
400
500
600
700
800
900
186.1
256.1
454.2
(SG)
528.2
(GGnM)
1100
1150
1200
1151.2
development. This software
y/tandem mass spectrometry
ntification of known and
ed by comparing the
spectrum of each native or
compared and the following were o
1. Glycosylation forms on N448 a
all the three samples (Table 2A
2 Glycoforms on N103 are simila
317.2
y3
3962
430.3
y4
471.2
b10++
540.2
586.8
y10-H2O++
b12++ y 0
b6
651.3
b13++
b7
740.3
y13-4H2O++
777.5
y21[3+]
791.9
M3H2O[3+]
8275
941.4
b10
1075.6
y9-H2O
1136.0
b21-H2O++
1172.6
y10-H2O
b22++
b12
10
1301.6
b13
y11
W double oxidation, relative abundance =0.13%
nder their selected-ion
on of modified peptides.
2. Glycosylation of TPA, I-TNK and G-TNK
A total of four glycosylation sites were identified, among which three of them are over
99% glycosylated They are N 448 in all of the three samples N103 in I-TNK and G-
.
abundance profile is quite diffe
is the same in the two samples
different. For the top five most
the two samples(Table 2B).
3 Gl
N117 f th t
150
200
250
300
350
400
450
500
550
600
650
700
750
800
850
900
950
1000
1050
1100
1150
1200
1250
1300
m/z
147.1
y1
186.1
y2-H2O
231.1
b7-2H2O[3+]
355.1
b7-H2O++
.
b5
b11++
523.3
y14-3H2O[3+]
y5
y11++
665.3
y18[3+]
699.8
b14++
726.3
b22[3+]
813.3
-
.
M[3+]
840.4
y15++
b9
874.5
y16-H2O++
1028.5
b11
b20++
y
.
,
TNK, and N117 in TPA. The forth glycosylation site, N184, was identified only in I-TNK
and only 19% of this site is glycosylated (Table 1). I-TNK has an additional glycosylation
site (N184) compared to G-TNK even though these two proteins share the same amino
acid sequence, suggesting differences in the manufacturing procedure. Examples of
MS/MS spectra of three identified glycopeptides are shown in Figure 3.
.
ycans on
are o e yp
from the glycans identified on
4. Glycosylation on N184 was onl
glycans contain sialic acid.


