5
Thermo Scientific Poster Note
•
BioPharma_PN63946
_E 11/13S
200
220
240
260
280
300
320
340
360
380
400
420
440
460
480
500
520
540
m/z
re :
•
Besides MS
1
mass accuracy and the presence of diagnostic ions in MS/MS
spectra, migration shifts can also be used to increase confidence in glycopeptide
identification
•
NGNA containing glycopeptides also show traces of NANA in MS/MS spectra
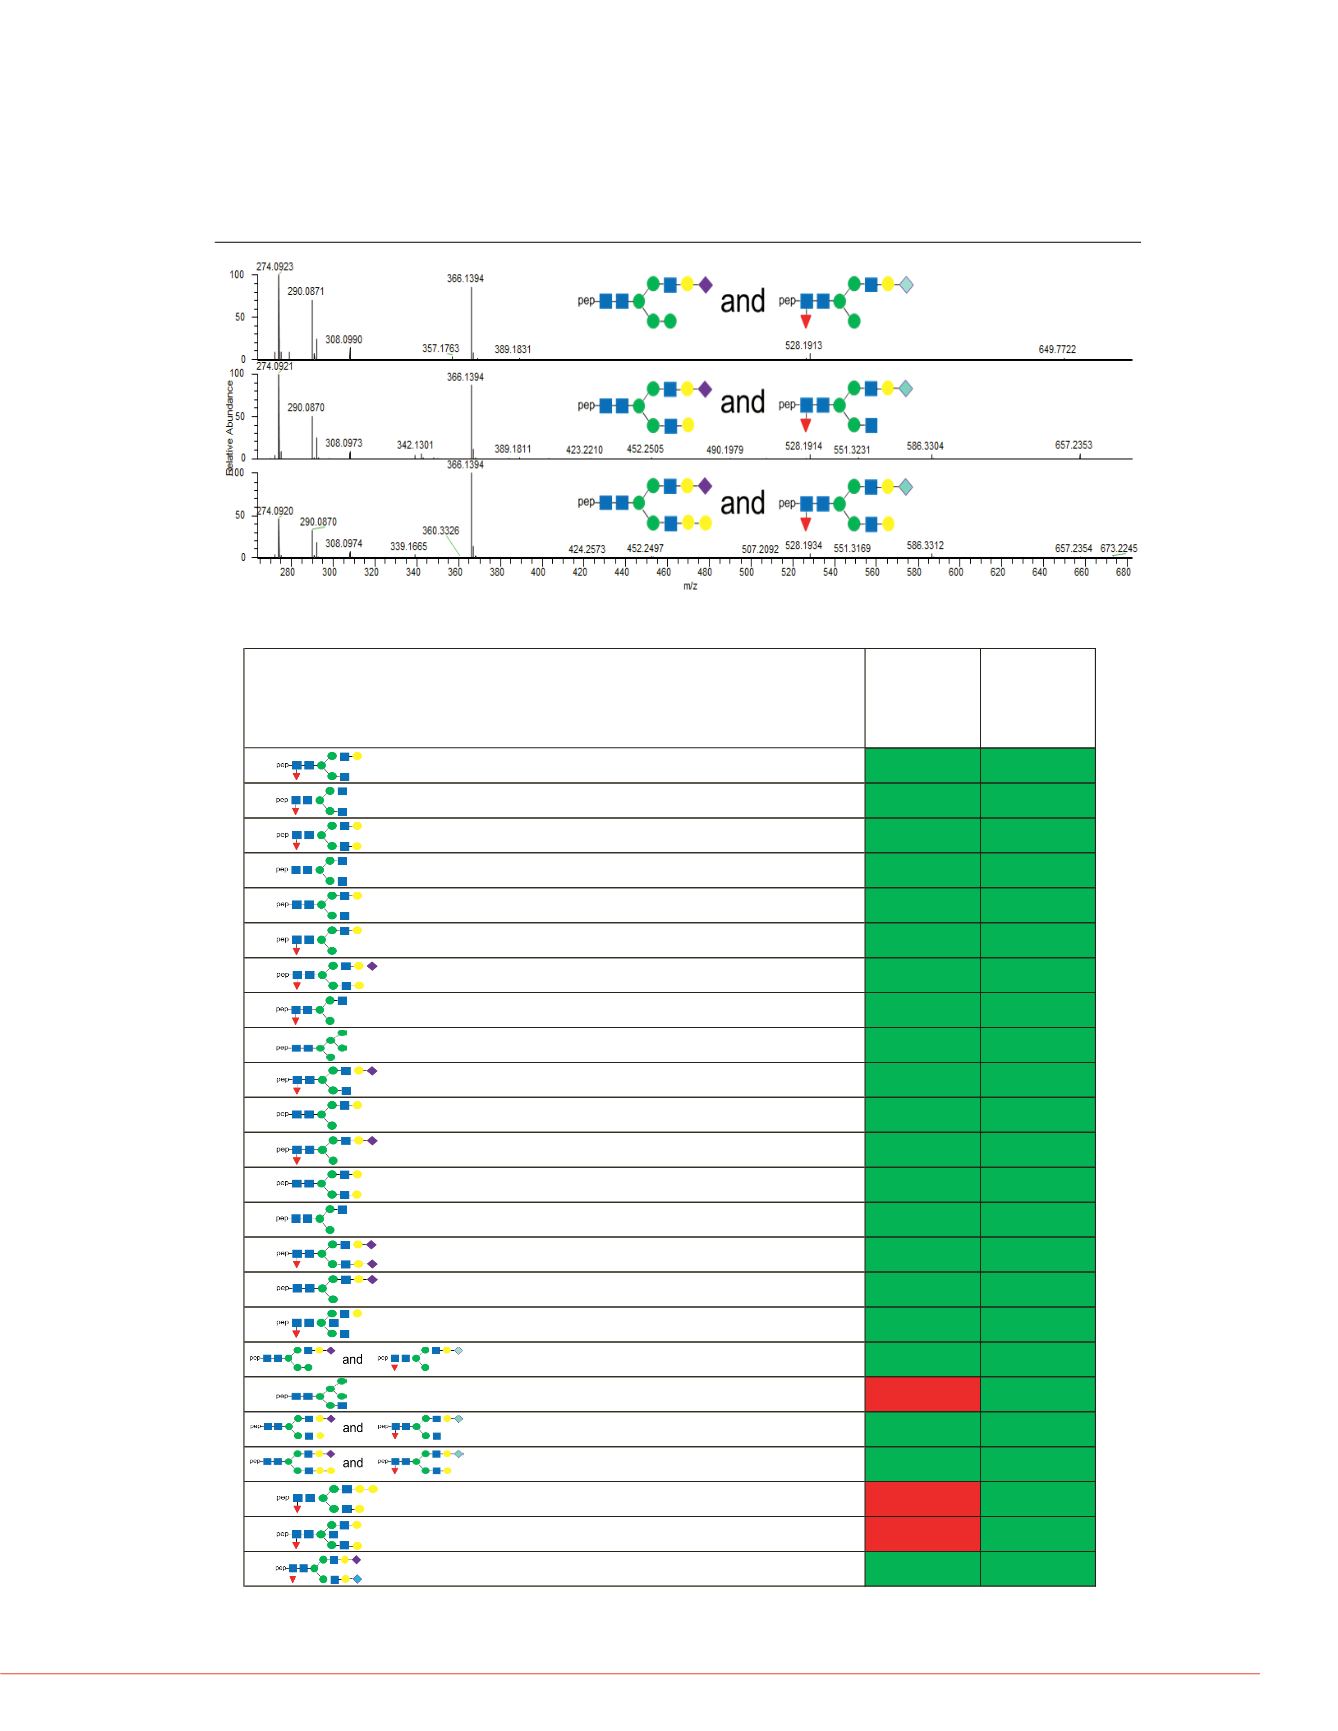
Presence of isobaric species
48
50
48.32
47.15
48.63
Glycopeptide (EEQY
N
STYR)
z
m/z theo
m/z exp
Mass
Accuracy
(ppm)
Relative
Abundance
(%)
Presence of
diagnostic ions in
MS2 (204, 274,
290, 292, 308, 366,
526, etc.)
Electrophoretic
Migration Pattern
3
932.6996 932.7084 9.5
39.98
3
878.6820 878.6897 8.8
37.23
3
986.7172 986.7230 5.9
7.51
3
829.9960 830.0021 7.3
4.91
3
884.0136 884.0188 5.9
3.21
3
865.0064 865.0125 7.0
1.06
3
1083.7490 1083.7549 5.5
0.93
3
810.9888 810.9944 6.9
0.89
3
802.6449 802.6499 6.2
0.83
3
1029.7314 1029.7366 5.1
0.68
3
816.3205 816.3255 6.2
0.47
3
962.0382 962.0433 5.3
0.39
3
938.0312 938.0362 5.3
0.39
3
762.3029 762.3060 4.1
0.33
3
1180.7808 1180.7868 5.1
0.29
3
913.3523 913.3571 5.3
0.28
3
1000.3927 1000.3946 1.9
0.17
3
967.3699 967.3748 5.1
0.12
3
870.3381 870.3444 7.3
0.10
3
1035.0630 1035.0680 4.8
0.06
3
1089.0806 1089.0863 5.2
0.05
3
1040.7348 1040.7415 6.5
0.04
3
1054.4103 1054.4168 6.2
0.04
3
1186.1124 1186.1183 5.0
0.02
0
540
528.1921
haracterization of Monoclonal Antibodies
Conclusions
A CESI prototype was coupled to a Q Exactive mass spectrometer for the
characterization of two monoclonal antibodies at the peptide lev l.
•
CESI-MS was capable of analyzing very small (< 300 Da) and very large peptides
FIGURE 7. Potential Isobaric Species
5
NL:2.99E10
TIC F:ms MS
130115_cems_tra
s-
20kv5psi60sec60
mi_03
NL:1.43E7
m/z=
1029.7212-
1029.7520F:ms
MS
130115_cems_tra
s-
20kv5psi60sec60
mi_03
NL:1.01E6
m/z=
1035.0525-
1035.0835F:ms
MS
130115_cems_tra
s-
20kv5psi60sec60
mi_03
Summary of Detected Glycopeptides


