4
Differentiate Minor Difference of Protein Structure in Biosimilar and Reference Products Using High-Resolution Orbitrap LC-MS/MSS
each of the samples: TPA, I-TANK
e compared.
Site of glycosylation
Sample
# glycoforms % glycosylation
Table 2. Comparison of glyc
abundance higher than 1% i
Abbreviations for glycan str
(Man) M
,
galactose (Gal) G,
neuraminc acid (NGNA) Sg.
Table 1. Identified glycosylation sites, percentage of glycosylation and the
number of glycoforms identified with high confidence.
e coverage
Q Exactive MS produced high quality,
tra which yielded high rates of
he MS/MS spectra resulted in high
). 100% protein sequence coverage
N448 Glycoform
N448+A2G2F
N 103
I-TNK
18
>99
N 103
G-TNK
11
>99
N117
TPA
14
>99
N 184
I-TNK
12
19
A
re 1 shows an example of the peptide
data file.
verage (bottom) of I-TNK.
N448+A2S1G0
N448+A2S1G0F
N448+A2S1G1F
N448 A2S2F
N 448
TPA
44
>99
N 448
I-TNK
36
>99
N 448
G-TNK
47
>99
+
N448+A3G3F
N448+A2Sg1S1F
N448+A3S1G2F
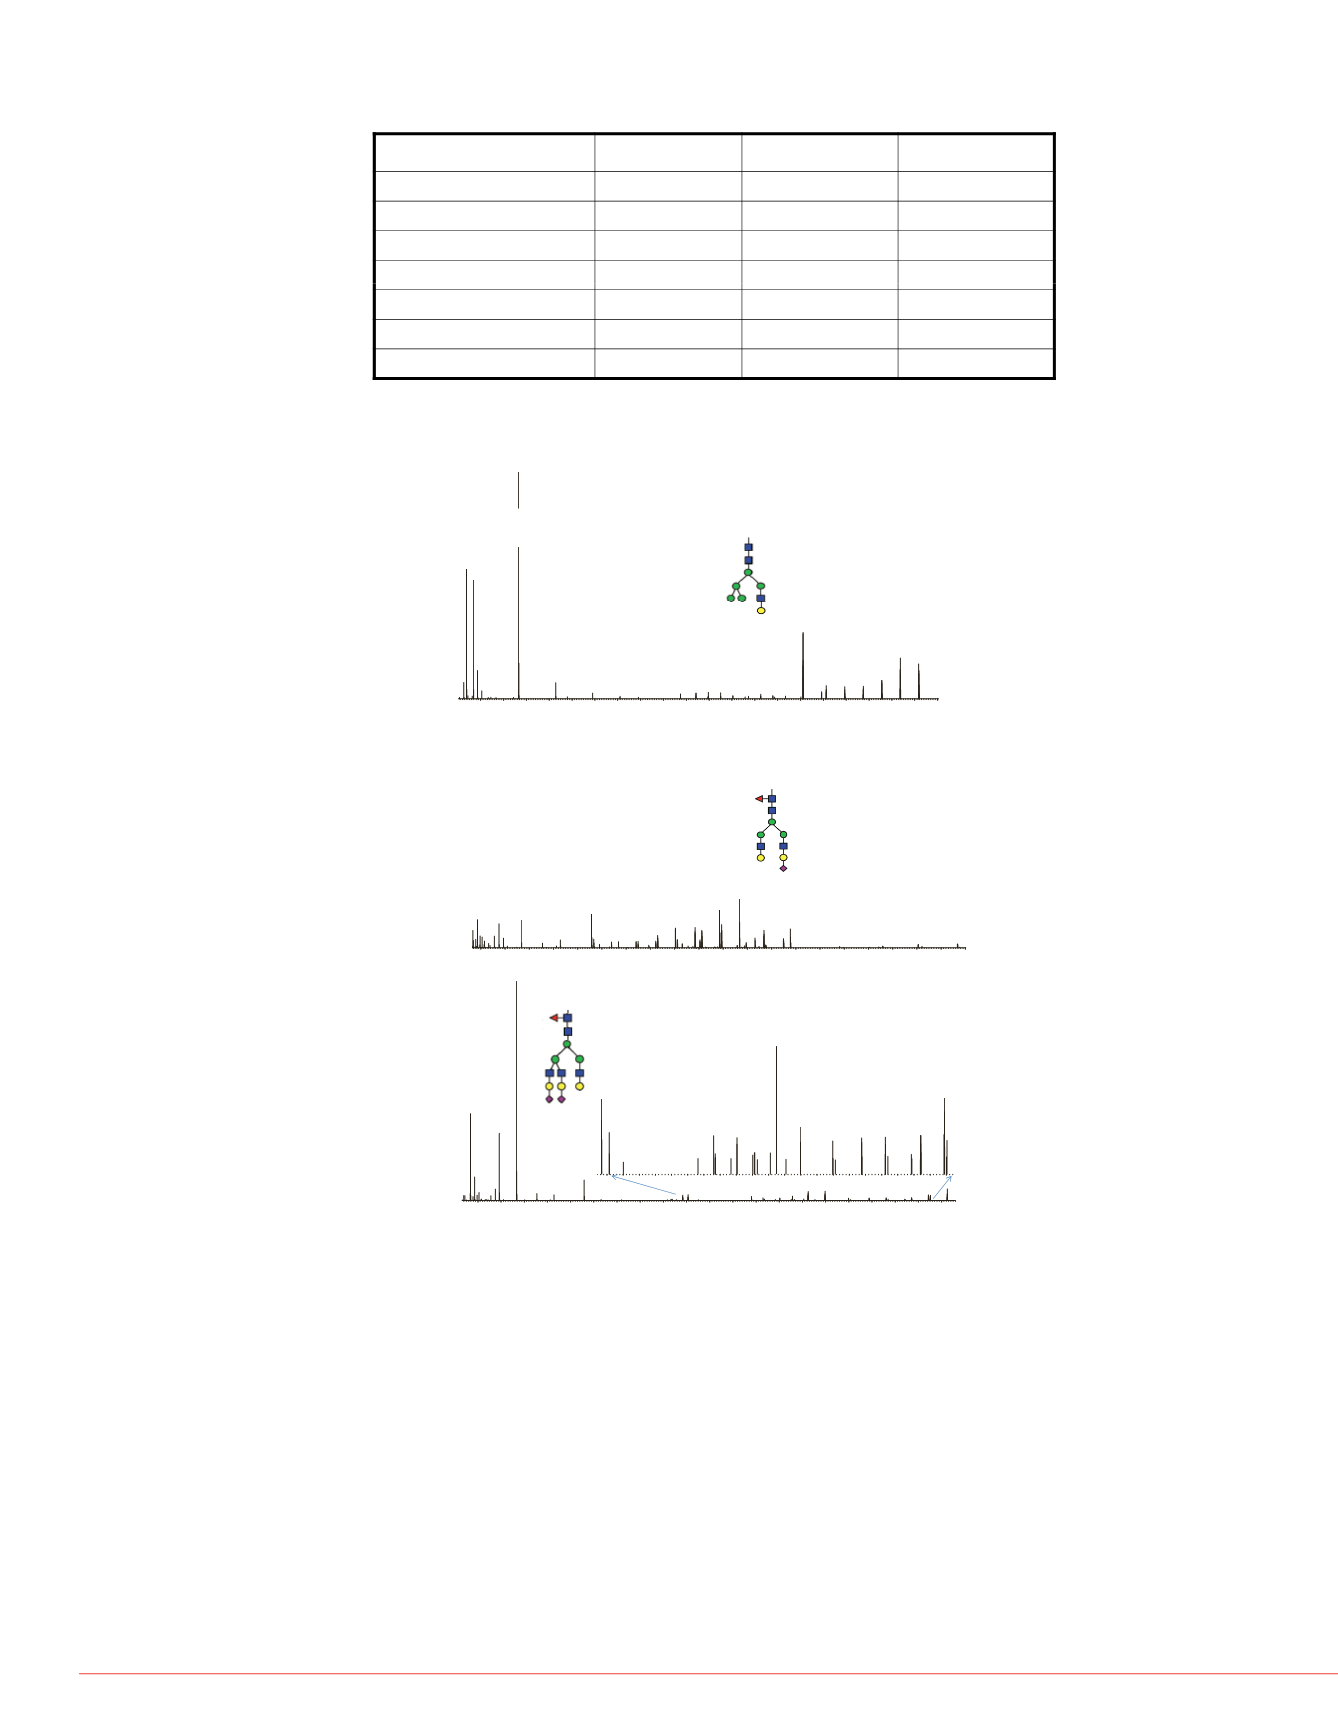
Figure 3. Examples of HCD spectra of identified glycopeptides. A: glycosylation
on N117. B: glycosylation on N448. C: glycosylation on N103.
366.1
(GGn)
N448+A3S2G0
N448+A3S2G1F
N448+A4S2G2F
A
138.1
168.1
204.1
(Gn)
102-GTWSTAESGAE
C
TNW
N
SSALAQK-122
N448+A4S1G3F
N448+A3S3F
N448+A4S3G1F
N448+A4S4F
200
300
400
500
600
700
800
900
1000
1100
1200
1300
1400
1500
1600
1700
1800
1900
2000
2100
2200
m/z
(G)
(M3)[3+]
(M)
186.1
b7++
528.2
(GGnM)
690.2
(Bn)++
Y1[3+]
1074.8 1142.5
Y2[3+]
1196.2
M1[3+]
1250.2
M2[3+]
M3[3+]
-M3[3+]
1425.9
-M-G[3+]
-M-M[3+]
-G[3+]
-M[3+]
M[3+]
1611.2
Y1++
1712.7
Y2++
1793.8
M1++
1874.8
M2++
1955.4
M3++
2036.8
M4++
2117.3
M5++
ut and sensitivity. More than 5 orders
s was routinely achieved (data not
low abundance modifications non
N103 Glycoform I-
N103+A2G0F
B
B
204.1
(Gn)
(Gn)
274.1
(SGGnM)[3+]
366.1
(GGn)
441-
C
TSQHLL
N
R-449
,
ariants. Figure 2 shows the high
double oxidized (on W) version
N103+A2G1F
0.
N103+A2G1M4F
N103+A2S1G0F
) and its double oxidized version
168.1
186.1
292.1
(S)
657.2
(SGGn)
1186.0
-SGGnM++
1267.0
-SGGn++
N103+A2G2
2.
N103+A2G2F
14.
N103+A2S1G1
5.
1158.6
y10
366.1
(GGn)
102-G
N
WSTAESGAE
C
TNWQSSALAQKPYSGR-129
200
300
400
500
600
700
800
900
1000
1100
1200
1300
1400
1500
1600
1700
1800
1900
2000
2100
2200
m/z
256.1
454.2
(SG)
528.2
(GGnM)
Y1-F++
(Bn-1)-SGGnM
Y1++
767.9
Y2-F++
Y2++
848.9
M1++
(Bn)-SGGnM
A1S1[3+]M1F++
929.9
M2++
1003.4
M2F++
M3++
A1G0M2++
1084.5
M3F++
A1G0M2F++
A1G1M2++
A1G1++
(Bn)-SG
A1S1M2++
-G-SG++
A2G1++
-GGnM++
1368.6
-SG++
-S-F++
-S++
1477.7
Y1
M2F
2166.9
M3F
N103+A2S1G1F
41.
N103+A2S2
3.
N103+A2S2F
26.
N103+A3S1G2F
2
C
1301.6
b13
WNSMILIGK-212
138.1
168.1
204.1
(Gn)
(Gn)
274.1
(SGGnM)[3+]
292.1
(S)
657.2
(SGGn)
1083.5
Y1-F[3+]
(Bn-1)++
1106.6
y20++
1380.6
A1G1M2[3+]
A1G1M2F[3+]
A2G2M2[3+]
1557.0
A2G2[3+]
1624.7
Y1-F++
1697.7
Y1++
A1G1M2++
2143.4
A1G1M2F++
A1G1++
.
N103+A3S2G1F
2.
The type of glycosylation forms and their relative abundance in the three samples were
850
900
950
1000
1050
1100
1150
1200
1250
1300
.4
8
842.4
b9
875.5
y8
b17++
941.4
b10
b18++
1010.5
b11-H2O
b19++
1028.5
b11
1061.6
y9
b20++
1097.5 1129.0
b21++
1188.5
b12
1210.6
1271.7
y11
891.5
b17-2H2O++
NSMILIGK-212,
200
300
400
500
600
700
800
900
1000
1100
1200
1300
1400
1500
1600
1700
1800
1900
2000
2100
2200
m/z
186.1
256.1
454.2
(SG)
528.2
(GGnM)
Y1-F[3+]
(Bn-1)++
1106.6
y20++
A1G1M2[3+]
A1G1M2F[3+]A2G1[3+]
A2G2M2[3+]
1557.0
A2G2[3+]
1624.7
Y1-F++
1697.7
Y1++
Y2++
M2++ M2F++
A1G1M2++
2143.4
A1G1M2F++
A1G1++
2224.9
A1G1F++
1100
1150
1200
1250
1300
1350
1400
1450
1500
1550
1600
1650
1700
1750
1800
1850
1900
1950
2000
2050
2100
2150
m/z
1151.2
1429.9
1483.6
1502.3
A2G1[3+]
1605.7
1654.0
1798.8
Y2++
1887.8
M2++
1961.3
M2F++
2041.8
2070.3
compared and the following were observed :
1. Glycosylation forms on N448 and their relative abundance are consistent among
all the three samples (Table 2A). Most of glycans on this site contain sialic acid.
2 Glycoforms on N103 are similar between I-TNK and G-TNK while the relative
3. Other covalent modificatio
Besides glycosylation, other co
samples included cysteine alky
formylation, glycation, etc. Also
peptides (data not shown).
3H2O[3+]
8275
941.4
b10
1075.6
y9-H2O
1136.0
b21-H2O++
1172.6
y10-H2O
b22++
b12
10
1301.6
b13
y11
abundance =0.13%
among which three of them are over
ree samples N103 in I-TNK and G-
.
,
abundance profile is quite different. Although the most abundant form, A2S1G1F
,
is the same in the two samples, the second and the third most abundant forms are
different. For the top five most abundant forms, only two of them were shared in
the two samples(Table 2B).
3 Gl
N117 f th t
f hi h
hi h i
l t l diff
t
Figure 4 shows an example of
deamidated on two different As
indentified with high confidenc
identified in I-TNK and G-TNK,
d id ti
i t t
0
850
900
950
1000
1050
1100
1150
1200
1250
1300
813.3
.
M[3+]
840.4
y15++
b9
874.5
y16-H2O++
1028.5
b11
b20++
y
,
ite, N184, was identified only in I-TNK
). I-TNK has an additional glycosylation
se two proteins share the same amino
nufacturing procedure. Examples of
are shown in Figure 3.
.
ycans on
are o e ype o g mannose, w c s comp e e y eren
from the glycans identified on other sites (Table 2C).
4. Glycosylation on N184 was only identified in I-TNK (Table 2D) and all of the
glycans contain sialic acid.
eam a on were cons s en a


