4
Sheathless Capillary Electrophoresis Mass Spectrometry (CESI-MS) as a Versatile and Powerful Tool for the Characterization of Monoclonal Antibodies
130115_cems_tras-20kv5psi60sec60mi_03
1/15/20138:47:17PM
130115_cems_tras-20kv5psi60sec60mi_03
#
17155
RT:
38.24
AV:
1
NL:
1.70E6
F:
FTMS+p NSId Fullms2 1030.07@hcd27.00 [100.00-3175.00]
200
220
240
260
280
300
320
340
360
380
400
420
440
460
480
500
520
540
m/z
0
5
10
15
20
25
30
35
40
45
RelativeAbundance
274.0921
366.1395
292.1025
256.0815
452.2511
528.1921
215.0547 232.0812
339.1666
439.2334
380.0956
245.0771
350.1456
296.7999
130115_cems_tras-20kv5psi60sec60mi_03
#
17201
RT:
38.33
AV:
1
NL:
1.32E6
F:
FTMS+p NSId Fullms2 1035.40@hcd27.00 [100.00-3190.00]
200
220
240
260
280
300
320
340
360
380
400
420
440
460
480
500
520
540
m/z
0
5
10
15
20
25
30
RelativeAbundance
274.0921
366.1394
290.0870
308.0973
215.0548 227.1030
342.1301
528.1914
256.0812
293.1051
389.1811
452.2505
490.1979 507.2023
270.1452
423.2210
403.2826
ose, CA,
2 54
52.30
54.93
.40
54.83
NL: 3.17E10
TIC F: FTMS + p NSI
Full ms
[150.00-1800.00] MS
130115_CEMS_Tras-
20kv5psi60sec60mi_01
_OK
NL: 3.25E10
TIC F: FTMS + p NSI
Full ms
[150.00-1800.00] MS
130115_cems_tras-
20kv5psi60sec60mi_02
NL: 3.01E10
TIC F: FTMS + p NSI
Full ms
[150.00-1800.00] MS
130115_cems_tras-
20kv5psi60sec60mi_03
2 54
54.10
3.14
54.90
3.33
54.14
3.11
NL: 3.70E10
TIC F: FTMS + p NSI
Full ms
[150.00-1800.00] MS
130115_CEMS_Beva-
20kv5psi60sec60mi_0
4
NL: 4.04E10
TIC F: FTMS + p NSI
Full ms
[150.00-1800.00] MS
130115_cems_beva-
20kv5psi60sec60mi_0
5
NL: 3.52E10
TIC F: FTMS + p NSI
Full ms
[150.00-1800.00] MS
130115_cems_beva-
20kv5psi60sec60mi_0
6
re :
In-depth Glycosylation Study
In addition to achieving high sequence coverage, the following glycosylation study
demonstrates further advantages of CESI-MS for the characterization of mAbs
FIGURE 6. MS/MS spectra of NANA and NGNA containing peptides
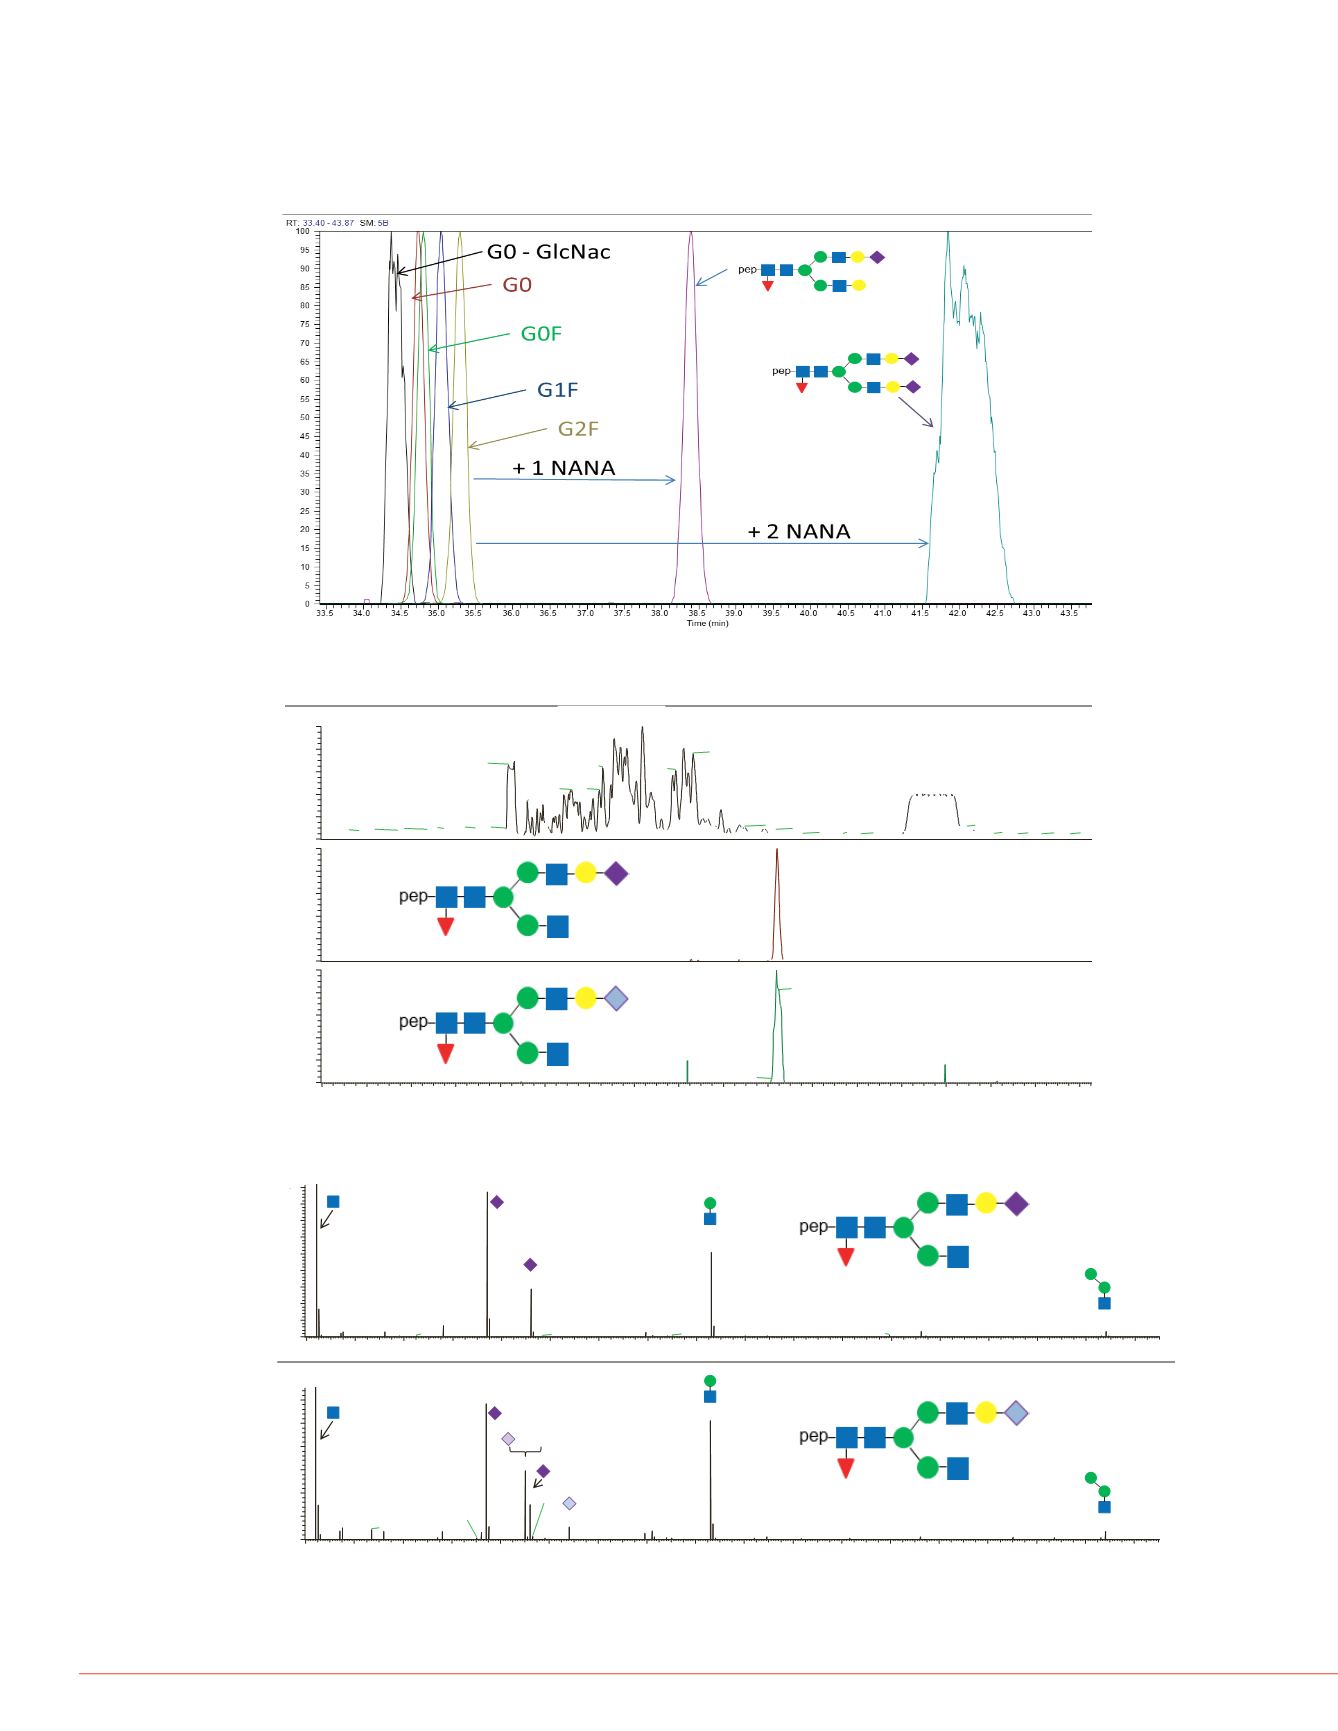
FIGURE 4. Impact of glycan structure on the migration time of a glycopeptide (EEQY
N
STYR)
FIGURE 5. Extracted ion electropherograms of NANA and NGNA containing glycopeptides
•
Besides MS
1
mass accuracy and the presence of diagnostic ions in MS/MS
spectra, migration shifts can also be used to increase confidence in glycopeptide
identification
•
NGNA containing glycopeptides also show traces of NANA in MS/MS spectra
Presence of isobaric species
- H2O
- H2O
- H2O
130115_cems_tras-20kv5psi60sec60mi_03
1/15/20138:47:17PM
RT:
17.93 -53.24
SM:
3B
18
20
22
24
26
28
30
32
34
36
38
40
42
44
46
48
50
52
Time (min)
0
20
40
60
80
100
0
20
40
60
80
100
RelativeAbundance
0
20
40
60
80
100
32.36
31.10
34.21 34.65
26.61
26.37
30.59
33.86
30.43
29.20
46.11
44.89
27.20
35.89
36.71
46.94
36.95
26.23
24.86
23.44
22.72
38.35
21.37
19.66
39.57
48.16
41.37
49.23 50.29 51.55
42.17
38.41
34.53
36.69
32.56
28.12
25.08
51.89
43.14
49.01
38.39
38.49
34.38
45.94
38.15
48.25
26.91
NL:2.99E10
TIC F:ms MS
130115_cems_tra
s-
20kv5psi60sec60
mi_03
NL:1.43E7
m/z=
1029.7212-
1029.7520F:ms
MS
130115_cems_tra
s-
20kv5psi60sec60
mi_03
NL:1.01E6
m/z=
1035.0525-
1035.0835F:ms
MS
130115_cems_tra
s-
20kv5psi60sec60
mi_03
Su
48
50
46.74 47.42 49.00
49.54
7.15 47.83
47.20
48.95
48.32
7.15
48.63


