4
Comprehensive Sequence and Post-translational Modifications Analysis of Monoclonal Antibody by Flash Digest and LC-High Resolution MS
igest, LC-MS and Data Analysis
lash Digest Kit
ed trypsin reactor that is combined
ns. The trypsin column makes
eously eliminating autolysis in
decrease of substrate
ion.
stion time was optimized by
15, 30, 45, 60, 75, 90, 105 and
d to LC-MS/MS and data analysis.
Simultaneous Identification a
Stressed IgG Samples
Differential oxidative stress was
mins. After simple trypsin digest
such as oxidation, deamidation,
identified with high confidence l
software.
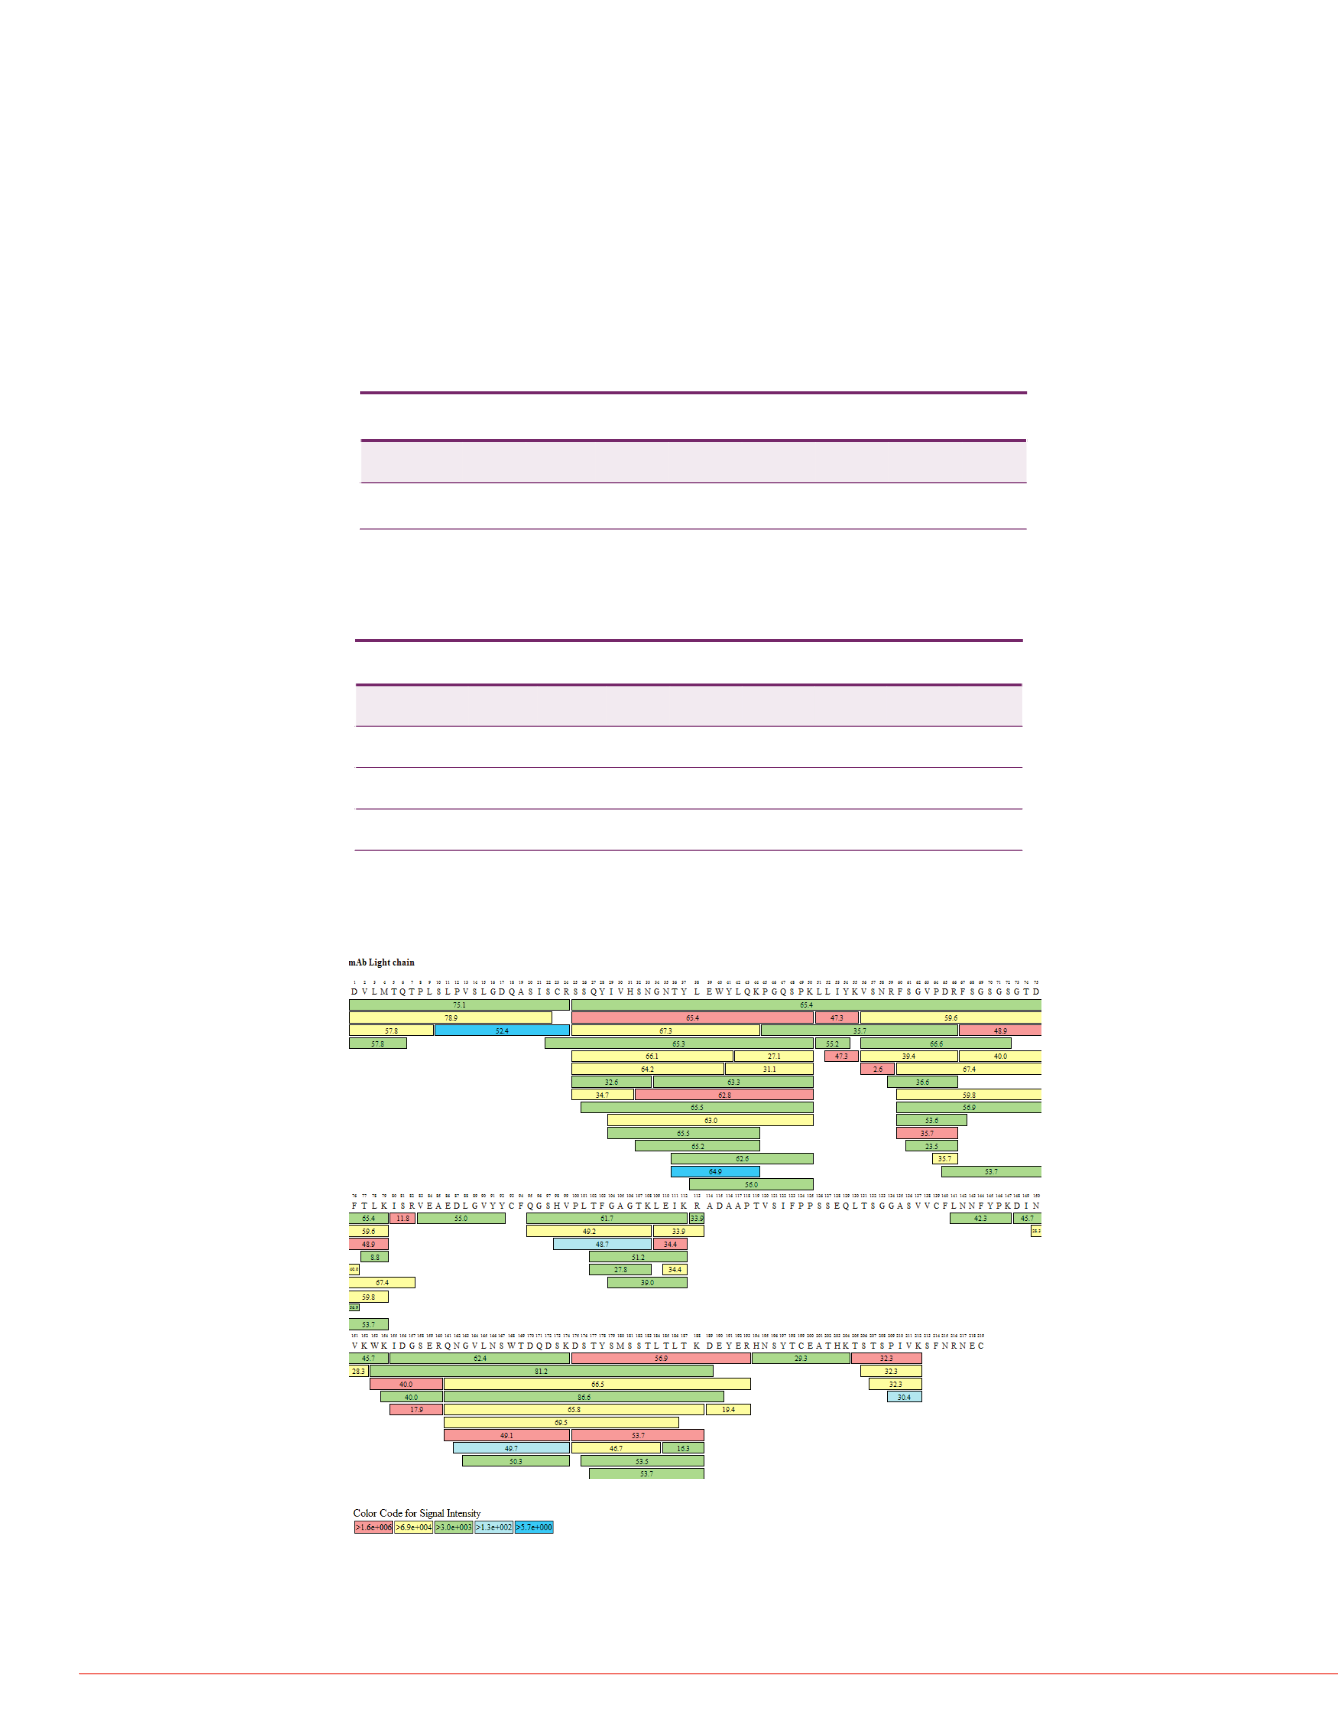
Sequence coverage maps of both light chain and heavy chain of native, non-reduced
mAb were generated from PepFinder software. Without reduction of disulfide linkages,
a 30-min digestion time is adequate to achieve good sequence coverage of >83% for
light chain and >79% for heavy chain, indicating an excellent digestion efficiency. The
uncovered sequences on light (Figure 2) and heavy chains (not shown) are due to the
non-reduced disulfide bonds on cysteine residue. As shown in Table 1, sequence
coverage of light and heavy chains was not increased by extending digestion time to
120 min.
The relative abundance of each
condition is calculated. The oxi
(M) 49, 304 and 393 in the hea
time increases from 30 to 120
significantly higher percentage
mass and confirmed by MS/MS
MS/MS spectrum was annotate
predicted (top panel) and experi
demonstrating the high confide
oxidation modification.
Relative percentages of each gl
deamidation of asparagine (N) ,
glutamic acid, glycation on lysin
Double and triple oxidation of c
TABLE 1. Sequence Coverage Summary of Native, Non-reduced IgG at Various
Digestion Times
Sequence
Coverage
15min 30min 45min
60min
75min
90min 105min 120min
Light Chain
78.5%
83.6%
83.6%
83.6%
82.6%
83.6%
83.6%
83.6%
Heavy Chain
79.1%
79.1%
79.1%
79.1%
79.1%
79.1%
79.1%
79.1%
ce was employed for MS analysis.
70,000 at FWHM
m/z
200) and
positive mode.
nd identification of PTMs are
re is designed for in-depth
utomatic workflow for
ther PTMs, i.e. oxidation,
and confirmation by MS/MS
ptide sequence coverage map
ized peptide and modification
are generated on the user
tions, the amino acid sites are
further interpretation.
; AGC=3e6; IT=100ms;
cans=1
AGC=1e5; IT=250ms;
m/z
130
LC-MS
Data Analysis
Relative
Abundance
15min
30min 45min
60min
75min
90min
105min 120min
N33+Deamidation
(Light Chain)
27.12%
28.12% 28.90%
27.87%
26.96%
29.84%
29.85%
29.85%
N162+Deamidatio
n (Light Chain)
15.98%
17.23% 18.38%
19.29%
20.29%
21.39%
21.68%
22.16%
M180+Oxidation
(Light Chain)
0.26%
0.35%
0.49%
0.70%
0.97%
0.98%
1.01%
1.31%
N83+Deamidation
(Heavy Chain)
1.44%
1.44%
1.62%
1.79%
1.81%
2.13%
2.14%
2.12%
Sequence Characterization of
When the same IgG is further re
light chain (Figure 3) and heavy
sequence coverage map (Figur
multiple times indicating by diffe
increases the identification confi
the identified peptide. The numb
peptide.
This data is comparable to the r
which IgG was denatured by gu
followed by trypsin digestion ov
efficiency is significantly improv
TABLE 2. Selected PTMs of Native, Non-reduced IgG at Various Digestion Times
FIGURE 3. Sequence Coverag
IgG Light Chain
FIGURE 2. Sequence Coverage Map (83.6%) of Native, Non-reduced IgG Light
Chain


