3
Thermo Scientific Poster Note
•
PN-64146-ASMS-EN-0614S
ffective workflow for
the sensitive liquid
nation with a software tool for
tein modifications.
was analyzed by liquid
ntary fragmentation
Thermo Scientific
TM
iled. Both expected and
lasses of therapeutic agents.
tion pathways. MAb
d upon storage in liquid,
nditions. These degradations
try throughout the
aracterization of chemical
and C-terminal processing,
ptimization of mass
xpected to significantly
aracterization methods.
re yields detailed and ultimate
as purchased and used in all
of 10 mg/mL, formulated in 9.0
drate, 0.7 mg/mL polysorbate
rent conditions for stressing
re to hydrogen peroxide), light
. To stress the mAb protein, 5
ark at 40
o
C.
L 5% H
2
O
2
and stored at room
rf tube and exposed to natural
k was stored at 40
o
C in dark
ethanol (Sigma, St. Louis,
n at 90
o
C in dark. The reduced
(Sigma, St. Louis, Missouri) in
mM ammonium bicarbonate
urs. Digestion was quenched
Peptides were separated by
C18 column (100 x 2.1 mm,
periments, the solvents used
FA (B). Gradient was
phy, were directly analyzed
as Spectrometer
.
. Full MS
/z
350-2,000 followed by data
clude alternating HCD and
spectra were collected with precursor ions with charge states from +2 to +8. ETD
spectra were only collected with precursor ions with charge states from +3 to+8.
Thermo Scientific™
IonMax
™ source with the heated
electrospray ionization (HESI)
was utilized with source parameters as sheath gas at 40, aux gas at 10, sweep gas at
1, vaporizer temperature at 350
o
C, ion transferring tube temperature at 275
o
C and
spray voltage at 3,500 v. The digests were analyzed using electron transfer
dissociation (ETD) and high energy collision dissociation (HCD) fragmentation.
Data Analysis
The LC-MS data were processed using PepFinder software1.0. The MS spectra were
analyzed with this novel peptide mapping software for sequence coverage information
and identification of modifications. The software looked for both expected and
unexpected modifications. The peptide identification settings include absolute MS
signal threshold at 2e4, maximum peptide mass at 10,000, N-glycosylation search
within CHO N-glycan, maximum numbers of modification/peptide at 1, mass changes
for unspecified modifications at -58 to 162.
Results
Protein Sequence Coverage
Rituximab is an IgG1 class chimeric monoclonal antibody, consisting of two light
chains with 213 amino acids and two heavy chains
2
. The antibody is glycosylated at
residue Asn301 of each heavy chain. Its attached glycans diverse in composition and
length. The variety and relative abundance of the glycoform is essential as part of the
antibody characterization. Additionally, mAbs are particularly sensitive to
environmental factors such as temperature changes, oxidation, light, ionic content, and
shear. Thus, besides complete protein sequence coverage, comprehensive
characterizations, which accurately detect these degradation changes during storage,
are in great need.
In this study, LC-MS data was acquired and then interpreted by PepFinder software
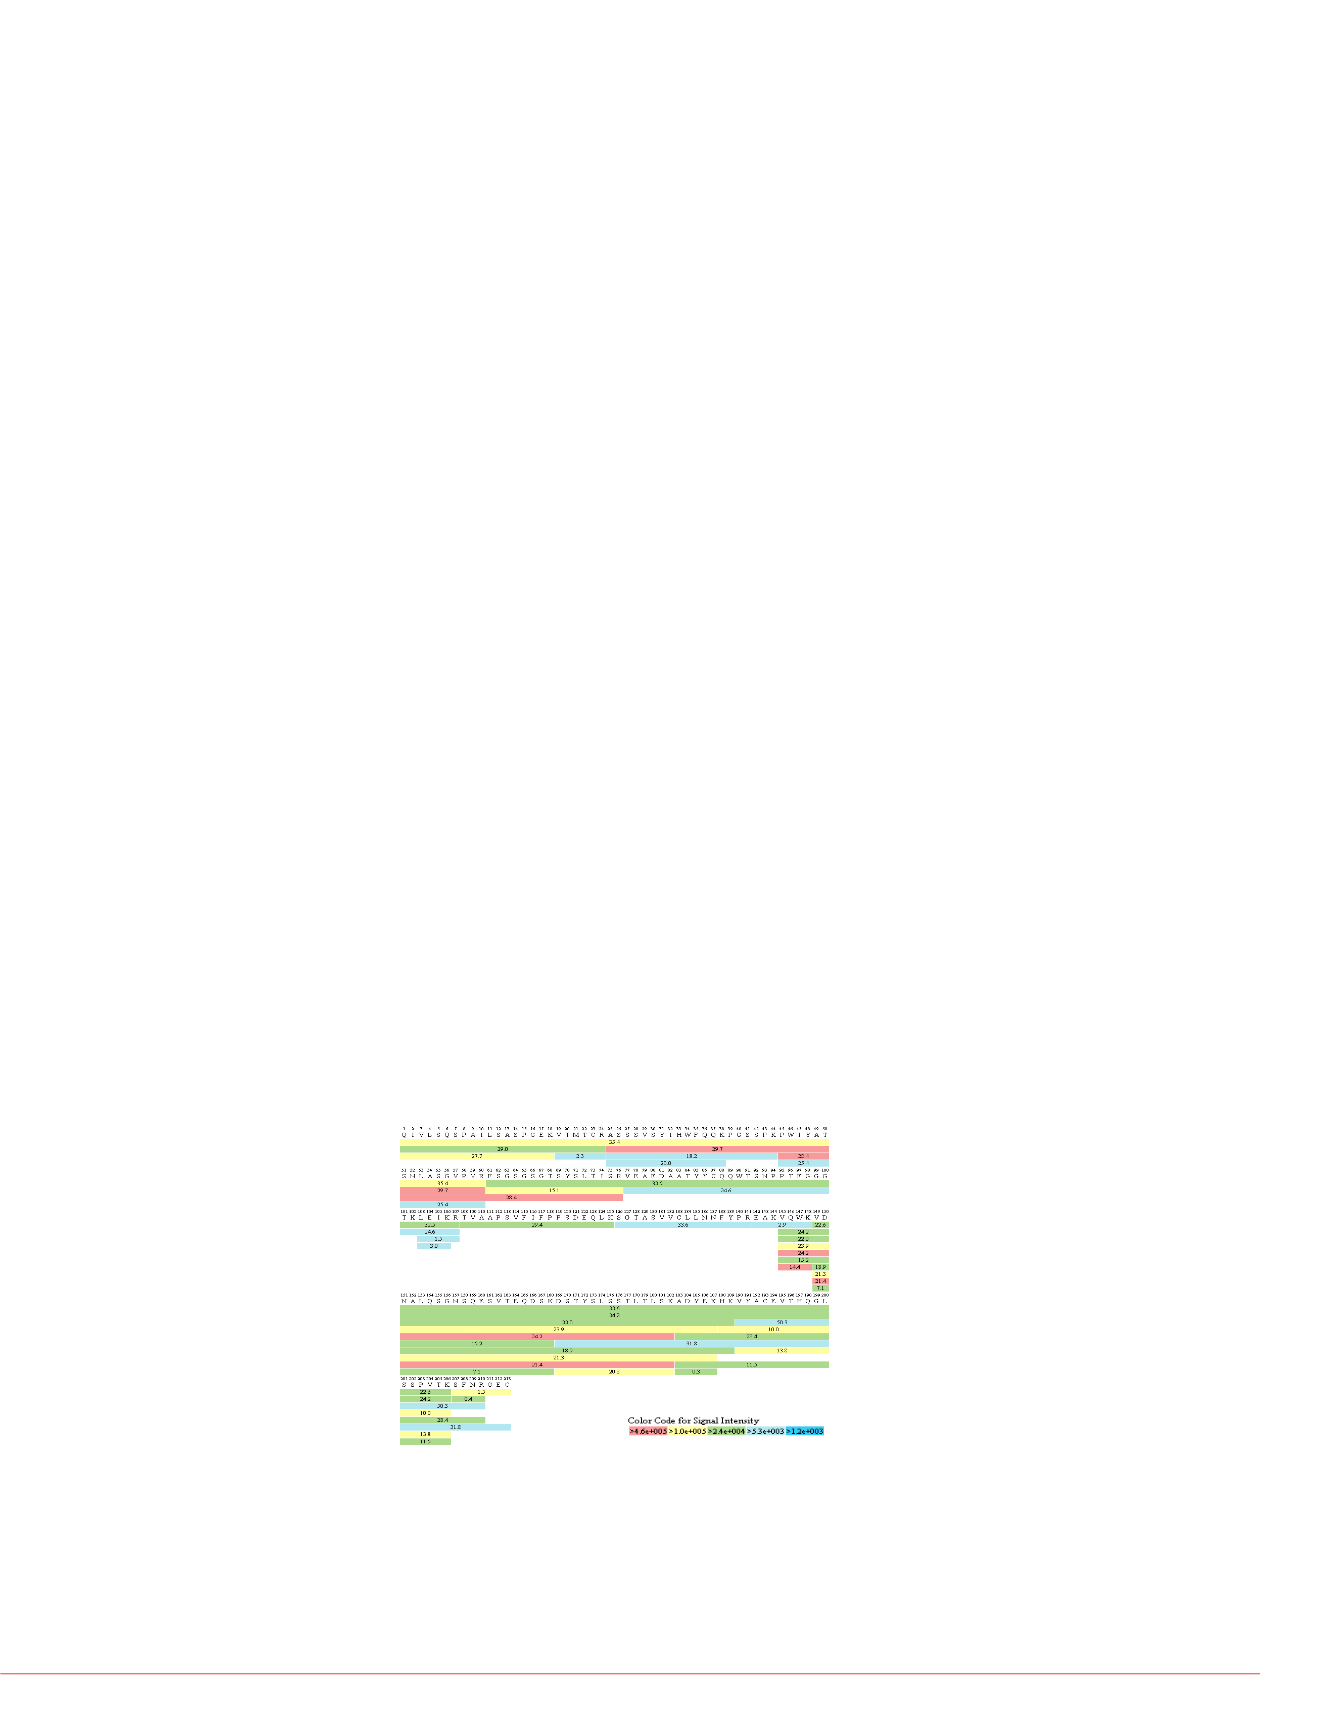
1.0. As shown in Figure 1, 100 % sequence coverage was achieved for light chain
from day light stressed rituximab. Both full MS precursor mass and MS/MS spectra
were utilized for matching of the sequence. Color coded blocks beneath amino acid
sequences shows the signal intensity of each peptide. The numbers included in the
color coded block represent the retention time for each peptide. In the same analysis,
100 % sequence coverage was also obtained for heavy chain from the day light
stressed rituximab as shown in Figure 2. A complete protein coverage serves as a
foundation for surveying degradation of the whole protein.
Protein Modifications
A list of modification sites of mAb were identified with high confidence MS/MS spectra
match and listed in Table 1. To determine the modification sites, each residue on the
peptide is theoretically modified, the MS/MS spectrum is predicted, and compared to
the experimental spectrum as shown in Figure 3,4,5.
FIGURE 1. Light chain sequence coverage of light stressed rituximab. Color
code is for the signal intensity of each peptide. Numbers under the sequences
represent retention time of the peptides.
TABLE 1. Modification summary fo
rituximab. All sequence were confi
front of the modification site to in
modification.
FIGURE 2. Heavy chain sequence
Modification on Heavy C
~Q1+NH3 loss
~N55+Deamidation
~N55+NH3 loss
M256+Oxidation
~C265+57.0220
~D284+H2O loss
N301+A2G0F
N301+A2G1F
N301+A2G2F
~W317+37.9417
N319+Deamidation
~N319+NH3 loss
~K321+37.9419
N329+Deamidation
K330+Glycation
~A331+70.0422
~I340+70.0424
~L372+57.0249
~S387+37.9458
~N388+Deamidation
~N388+NH3 loss
~S407+H2O loss
~H437+57.0342


