5
Thermo Scientific Poster Note
•
PN-64146-ASMS-EN-0614S
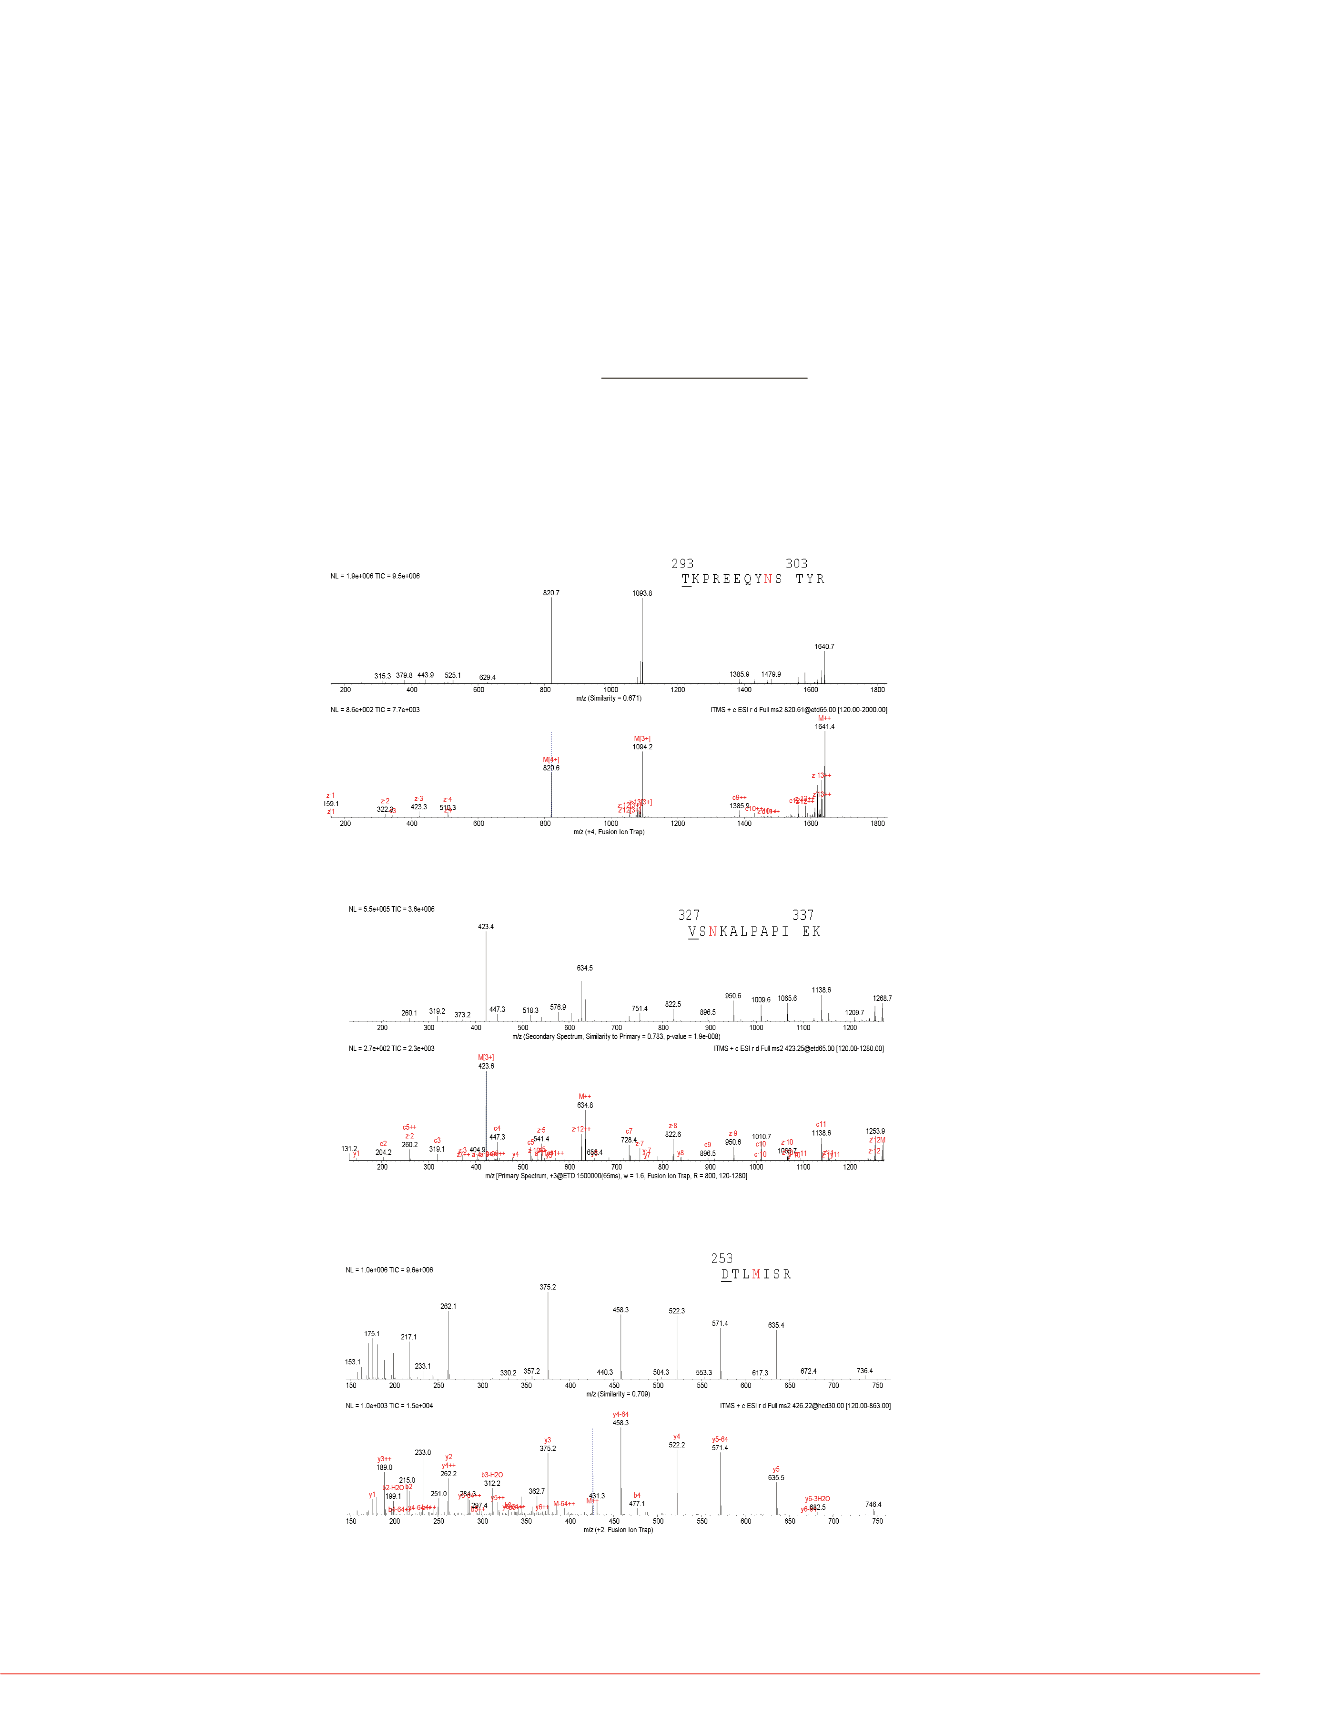
match as shown in Figure 3,4,5. Figure 3 presented both predicted and Fusion ion trap
acquired ETD spectrum of T293-R305 (N301+A2G1F) from the heavy chain. The two
spectra of the glycopeptide are well aligned for both fragment ion masses and relative
intensities. Following are Figure 4 and 5, which show pairs of spectra (predicted
versus experimental) from a deamidated peptide (ETD) and a oxidized peptide (HCD),
respectively. Correlations between both
m/z
and their relative intensities provide high
confidence identification for these modified peptides. Additionally, complementary
fragmentation techniques help deliver unambiguous and comprehensive
characterization, especially localization of labile modifications such as glycosylation.
The relative quantitation of the modifications were based on the peak areas of
modified and unmodified forms of the peptide as the equation below. The abundance
as shown in Table 1 represents relative area % of the modifications.
Conclusion
Results from this study show that m
characterized using the high resolut
complementary fragmentation tech
new generation peptide mapping s
References
1. Zhongqi Zhang. Large-Scale
Modifications in Therapeutic
2. Martin Samonig, Christian H
Monoclonal Antibody Rituxim
Spectrometer. Thermo Fisher
FIGURE 4. Predicted and experimental ETD spectra of V327-K338 (N329+Deamidation)
from heavy chain.
TABLE 2. Comparison of oxidati
between oxidative stressed sam
heavy chain from light stressed
spectra. An ~ sign is labeled in
mate location of the
FIGURE 3. Predicted and experimental ETD spectra of T293-R305 (N301+A2G1F)
from heavy chain. Top spectrum is the PepFinder predicted spectrum; bottom
spectrum is Fusion acquired ETD spectrum.
t stressed rituximab.
bundance
100.00%
9.22%
5.05%
6.36%
71.78%
13.45%
46.54%
54.60%
9.32%
2.66%
5.37%
4.33%
4.59%
2.67%
1.73%
6.77%
26.36%
96.32%
10.70%
1.34%
5.27%
2.33%
89.37%
Area of modified peptide
Relative area %
of modification
X 100
Area sum of all related peptides
(native + all modified forms)
=
FIGURE 5. Predicted and experimental HCD spectra of D253-R259
(M256+Oxidation) from heavy chain.
Predicted
Experimental
Predicted
Experimental
Experimental
Predicted
Oxidative stress
Abund
~M20+Oxidation
100.0
M34+Oxidation
72.8
M256+Oxidation
100.0
FIGURE 6. Deamidated and suc
PH10 40
o
C, light stress sample
abundance levels of deamidate
and N388 respectively.
Artificial modifications happen duri
Unstressed sample is thus include
o
C without any stress treatment. I
stressed samples. Modifications le
control. As shown in TABLE 2, oxi
72-100 % after treatment with H
2
deamidation and succinimide inter
example, asparagine (N) 55 was i
compared to other samples at aro
remained below 6 % for all the sa
All trademarks are the property of Thermo Fi
encourage use of these products in any man
0.00%
5.00%
10.00%
15.00%
20.00%
25.00%
Control Native,
40c
PH10
Light
stress
6c) N319+Deamidation
0.00%
0.50%
1.00%
1.50%
2.00%
2.50%
Control Native,
40c
PH10
Light
stress
6g) ~N388+Deamidation
0.00%
20.00%
40.00%
60.00%
80.00%
Control Native,
40c
PH10
Light
stress
6a) ~N55+Deamidation
0.00%
2.00%
4.00%
6.00%
8.00%
10.00%
Control Native,
40c
PH10
Light
stress
6e) N329+Deamidation


