4
Degradation Profiling of a Monoclonal Antibody Using Multiple Fragmentation Techniques and a Novel Peptide Mapping Software
match as shown in Figure 3,
acquired ETD spectrum of T
spectra of the glycopeptide a
intensities. Following are Fig
versus experimental) from a
respectively. Correlations bet
confidence identification for t
fragmentation techniques hel
characterization, especially l
The relative quantitation of t
modified and unmodified for
as shown in Table 1 represe
harge states from +2 to +8. ETD
ith charge states from +3 to+8.
ated
electrospray ionization (HESI)
s at 40, aux gas at 10, sweep gas at
ng tube temperature at 275
o
C and
ed using electron transfer
ociation (HCD) fragmentation.
r software1.0. The MS spectra were
e for sequence coverage information
ooked for both expected and
ion settings include absolute MS
at 10,000, N-glycosylation search
ification/peptide at 1, mass changes
antibody, consisting of two light
s
2
. The antibody is glycosylated at
glycans diverse in composition and
glycoform is essential as part of the
particularly sensitive to
es, oxidation, light, ionic content, and
coverage, comprehensive
degradation changes during storage,
interpreted by PepFinder software
rage was achieved for light chain
ecursor mass and MS/MS spectra
coded blocks beneath amino acid
tide. The numbers included in the
each peptide. In the same analysis,
heavy chain from the day light
lete protein coverage serves as a
protein.
with high confidence MS/MS spectra
dification sites, each residue on the
trum is predicted, and compared to
4,5.
light stressed rituximab. Color
e. Numbers under the sequences
FIGURE 4. Predicted and ex
from heavy chain.
TABLE 1. Modification summary for the residues in heavy chain from light stressed
rituximab. All sequence were confirmed by tandem spectra. An ~ sign is labeled in
front of the modification site to indicate the approximate location of the
modification.
FIGURE 3. Predicted and ex
from heavy chain. Top spec
spectrum is Fusion acquire
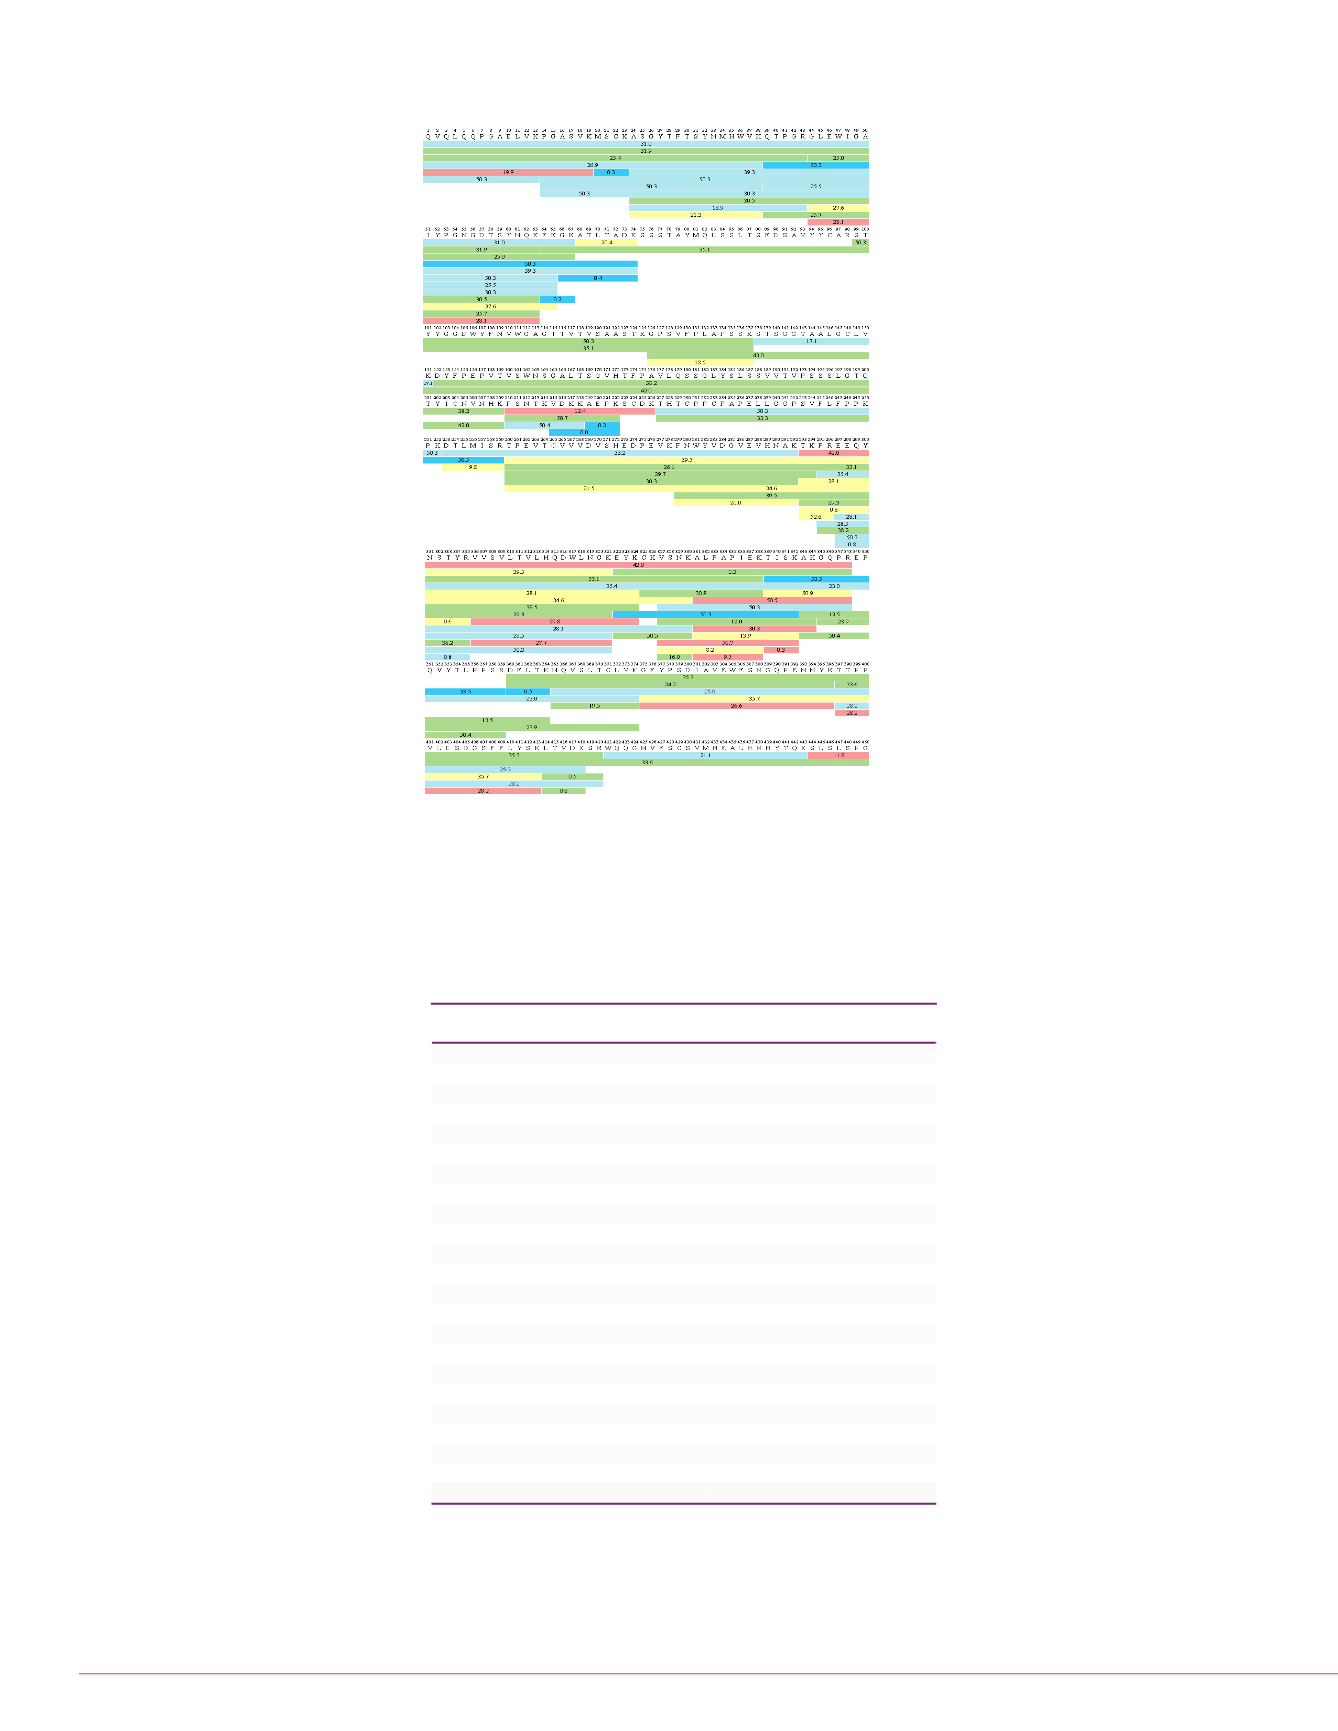
FIGURE 2. Heavy chain sequence coverage of light stressed rituximab.
Modification on Heavy Chain
Abundance
~Q1+NH3 loss
100.00%
~N55+Deamidation
9.22%
~N55+NH3 loss
5.05%
M256+Oxidation
6.36%
~C265+57.0220
71.78%
~D284+H2O loss
13.45%
N301+A2G0F
46.54%
N301+A2G1F
54.60%
N301+A2G2F
9.32%
~W317+37.9417
2.66%
N319+Deamidation
5.37%
~N319+NH3 loss
4.33%
~K321+37.9419
4.59%
N329+Deamidation
2.67%
K330+Glycation
1.73%
~A331+70.0422
6.77%
~I340+70.0424
26.36%
~L372+57.0249
96.32%
~S387+37.9458
10.70%
~N388+Deamidation
1.34%
~N388+NH3 loss
5.27%
~S407+H2O loss
2.33%
~H437+57.0342
89.37%
Relative area
of modificatio
FIGURE 5. Predicted and ex
(M256+Oxidation) from hea
Predicted
Experimental
Predicted
Experimental
Experimental
Predicted


