6
Degradation Profiling of a Monoclonal Antibody Using Multiple Fragmentation Techniques and a Novel Peptide Mapping Software
oth predicted and Fusion ion trap
) from the heavy chain. The two
ragment ion masses and relative
pairs of spectra (predicted
D) and a oxidized peptide (HCD),
relative intensities provide high
Additionally, complementary
and comprehensive
fications such as glycosylation.
sed on the peak areas of
equation below. The abundance
modifications.
Conclusion
Results from this study show that mAb degradation can be comprehensively
characterized using the high resolution/accurate mass spectrometer with
complementary fragmentation techniques (HCD, ETD) and PepFinder software as the
new generation peptide mapping software.
References
1. Zhongqi Zhang. Large-Scale Identification and Quantification of Covalent
Modifications in Therapeutic Proteins. Anal. Chem. 2009, 81, 8354-8364.
2. Martin Samonig, Christian Huber, Kai Scheffler. LC/MS Analysis of the
Monoclonal Antibody Rituximab Using the Q Exactive Benchtop Orbitrap Mass
Spectrometer. Thermo Fisher Scientific Application note 591.
a of V327-K338 (N329+Deamidation)
TABLE 2. Comparison of oxidation level of methionines from heavy chain
between oxidative stressed sample and the control. ND denotes not detected.
a of T293-R305 (N301+A2G1F)
redicted spectrum; bottom
eptide
X 100
ted peptides
ied forms)
a of D253-R259
Oxidative stress
Abundance
Control
Abundance
~M20+Oxidation
100.00%
~M20+Oxidation
ND
M34+Oxidation
72.82%
M34+Oxidation
ND
M256+Oxidation
100.00%
M256+Oxidation
1.89%
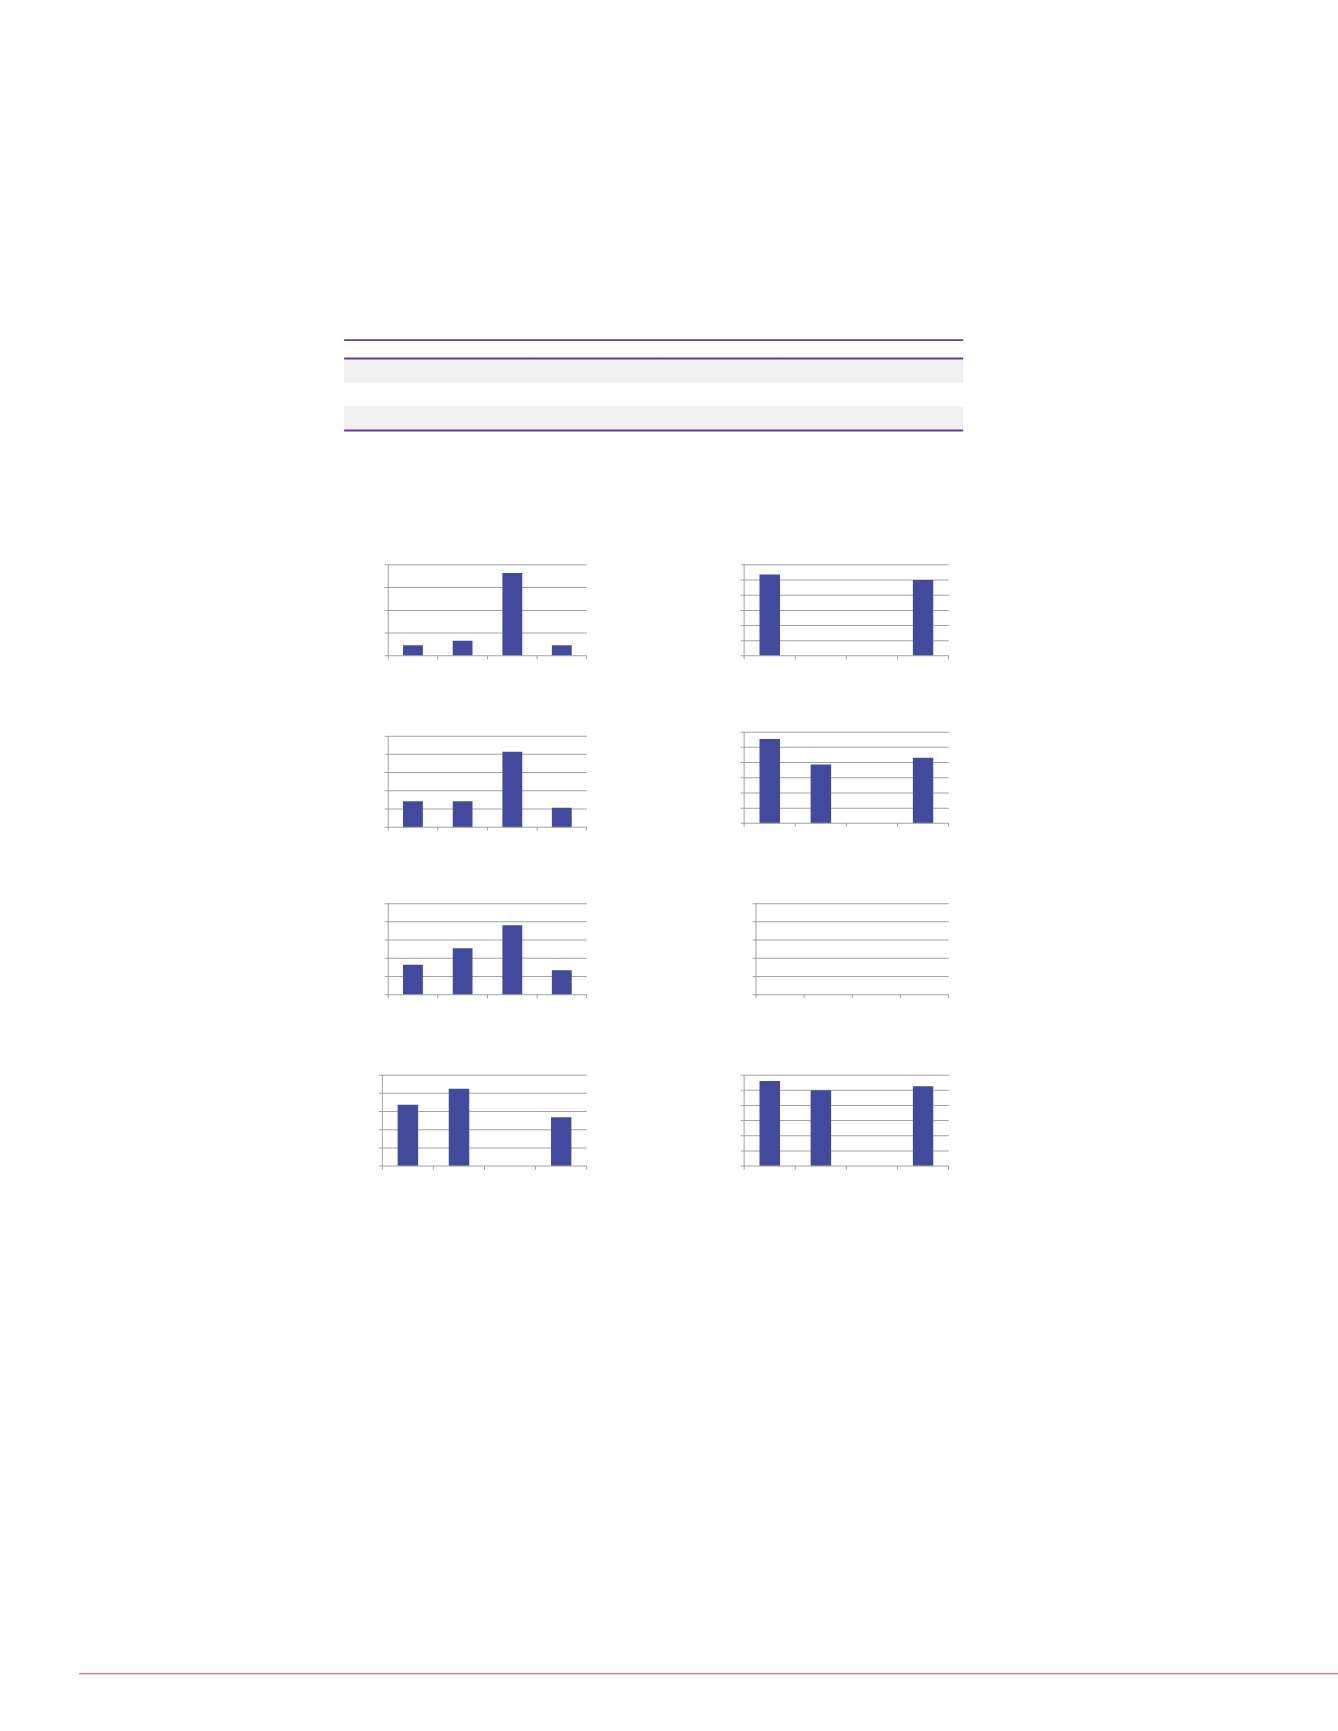
FIGURE 6. Deamidated and succinimide asparagine profiling for native 40
o
C,
PH10 40
o
C, light stress samples versus control. Column charts 6a-6h show
abundance levels of deamidated and succimide asparagine of N55, N319, N329
and N388 respectively.
Artificial modifications happen during sample preparation prior to LC-MS analysis.
Unstressed sample is thus included as a control. The control is rituximab stored at 4
o
C without any stress treatment. It was digested following the same protocol as
stressed samples. Modifications levels on the stressed samples are compared to the
control. As shown in TABLE 2, oxidation levels were increased from less than 2 % to
72-100 % after treatment with H
2
O
2
. Figure 6 also shows the variation of
deamidation and succinimide intermediate levels among the stressed samples. For
example, asparagine (N) 55 was increased to over 70 % abundance at pH 10
compared to other samples at around 10 %. Whereas Succinimide levels of N329
remained below 6 % for all the samples.
All trademarks are the property of Thermo Fisher Scientific and its subsidiaries. This information is not intended to
encourage use of these products in any manners that might infringe the intellectual property rights of others.
0.00%
1.00%
2.00%
3.00%
4.00%
5.00%
6.00%
Control Native,
40c
PH10
Light
stress
6b) ~N55+NH3 loss
0.00%
5.00%
10.00%
15.00%
20.00%
25.00%
Control Native,
40c
PH10
Light
stress
6c) N319+Deamidation
0.00%
0.50%
1.00%
1.50%
2.00%
2.50%
Control Native,
40c
PH10
Light
stress
6g) ~N388+Deamidation
0.00%
1.00%
2.00%
3.00%
4.00%
5.00%
6.00%
Control Native,
40c
PH10
Light
stress
6h) ~N388+NH3 loss
0.00%
20.00%
40.00%
60.00%
80.00%
Control Native,
40c
PH10
Light
stress
6a) ~N55+Deamidation
0.00%
1.00%
2.00%
3.00%
4.00%
5.00%
6.00%
Control Native,
40c
PH10
Light
stress
6d)~N319+NH3 loss
0.00%
2.00%
4.00%
6.00%
8.00%
10.00%
Control Native,
40c
PH10
Light
stress
6e) N329+Deamidation
0.00%
20.00%
40.00%
60.00%
80.00%
100.00%
Control Native,
40c
PH10
Light
stress
6f) N329+NH3 loss
PO64146-EN 0614S


