5
Thermo Scientific Poster Note
•
PN-64086-ASMS-EN-0614S
Conclusion
A complete workflow has been d
and post-translational modificatio
A 30-min digestion time de
immobilized trypsin colum
non-reduced IgG light and
alkylation increased seque
chains, respectively.
Oxidative study results sho
heavy chain is dose-depen
glycoforms did not change
This workflow could greatl
time while providing great
unintentionally incurred oxi
may be rapidly analyzed fo
Reference
1. Samaranayake H, Wirth T, Sc
Challenges in monoclonal antibo
2. Durocher Y, Butler M (2009) E
production.
Curr Opin Biotechnol
Simultaneous Identification and Relative Quantitation of PTMs in Oxidatively
Stressed IgG Samples
Differential oxidative stress was induced by hydrogen peroxide at 15, 30, 60, 90, 120
mins. After simple trypsin digestion, samples were analyzed by LC-MS/MS. PTMs
such as oxidation, deamidation, and glycation at different amino acid sites are
identified with high confidence levels as shown in the summary (Table 3) from
software.
TABLE 3. Summary of Selected
Oxidatively Stressed IgG Heav
y chain of native, non-reduced
t reduction of disulfide linkages,
equence coverage of >83% for
cellent digestion efficiency. The
ains (not shown) are due to the
hown in Table 1, sequence
by extending digestion time to
The relative abundance of each modification in different samples under same LC-MS
condition is calculated. The oxidative study of IgG shows that oxidation of methionine
(M) 49, 304 and 393 in the heavy chain is dose-dependent as the oxidation reaction
time increases from 30 to 120 min, while unquenched sample demonstrated
significantly higher percentage of oxidation. M49 oxidation was identified by isotopic
mass and confirmed by MS/MS spectrum in PepFinder software. The experimental
MS/MS spectrum was annotated automatically in the software. The well matched
predicted (top panel) and experimental (bottom panel) spectra are shown in Figure 4,
demonstrating the high confident identification and confirmation of peptide with
oxidation modification.
Relative percentages of each glycoform, double oxidation of methionine and
deamidation of asparagine (N) , H
2
O loss of threonine, serine, aspartic acid and
glutamic acid, glycation on lysine did not change over the reaction time as expected.
Double and triple oxidation of cysteine were monitored but not observed.
Non-reduced IgG at Various
5min
90min 105min 120min
2.6%
83.6%
83.6%
83.6%
9.1%
79.1%
79.1%
79.1%
5min
90min
105min 120min
6.96%
29.84%
29.85%
29.85%
0.29%
21.39%
21.68%
22.16%
0.97%
0.98%
1.01%
1.31%
1.81%
2.13%
2.14%
2.12%
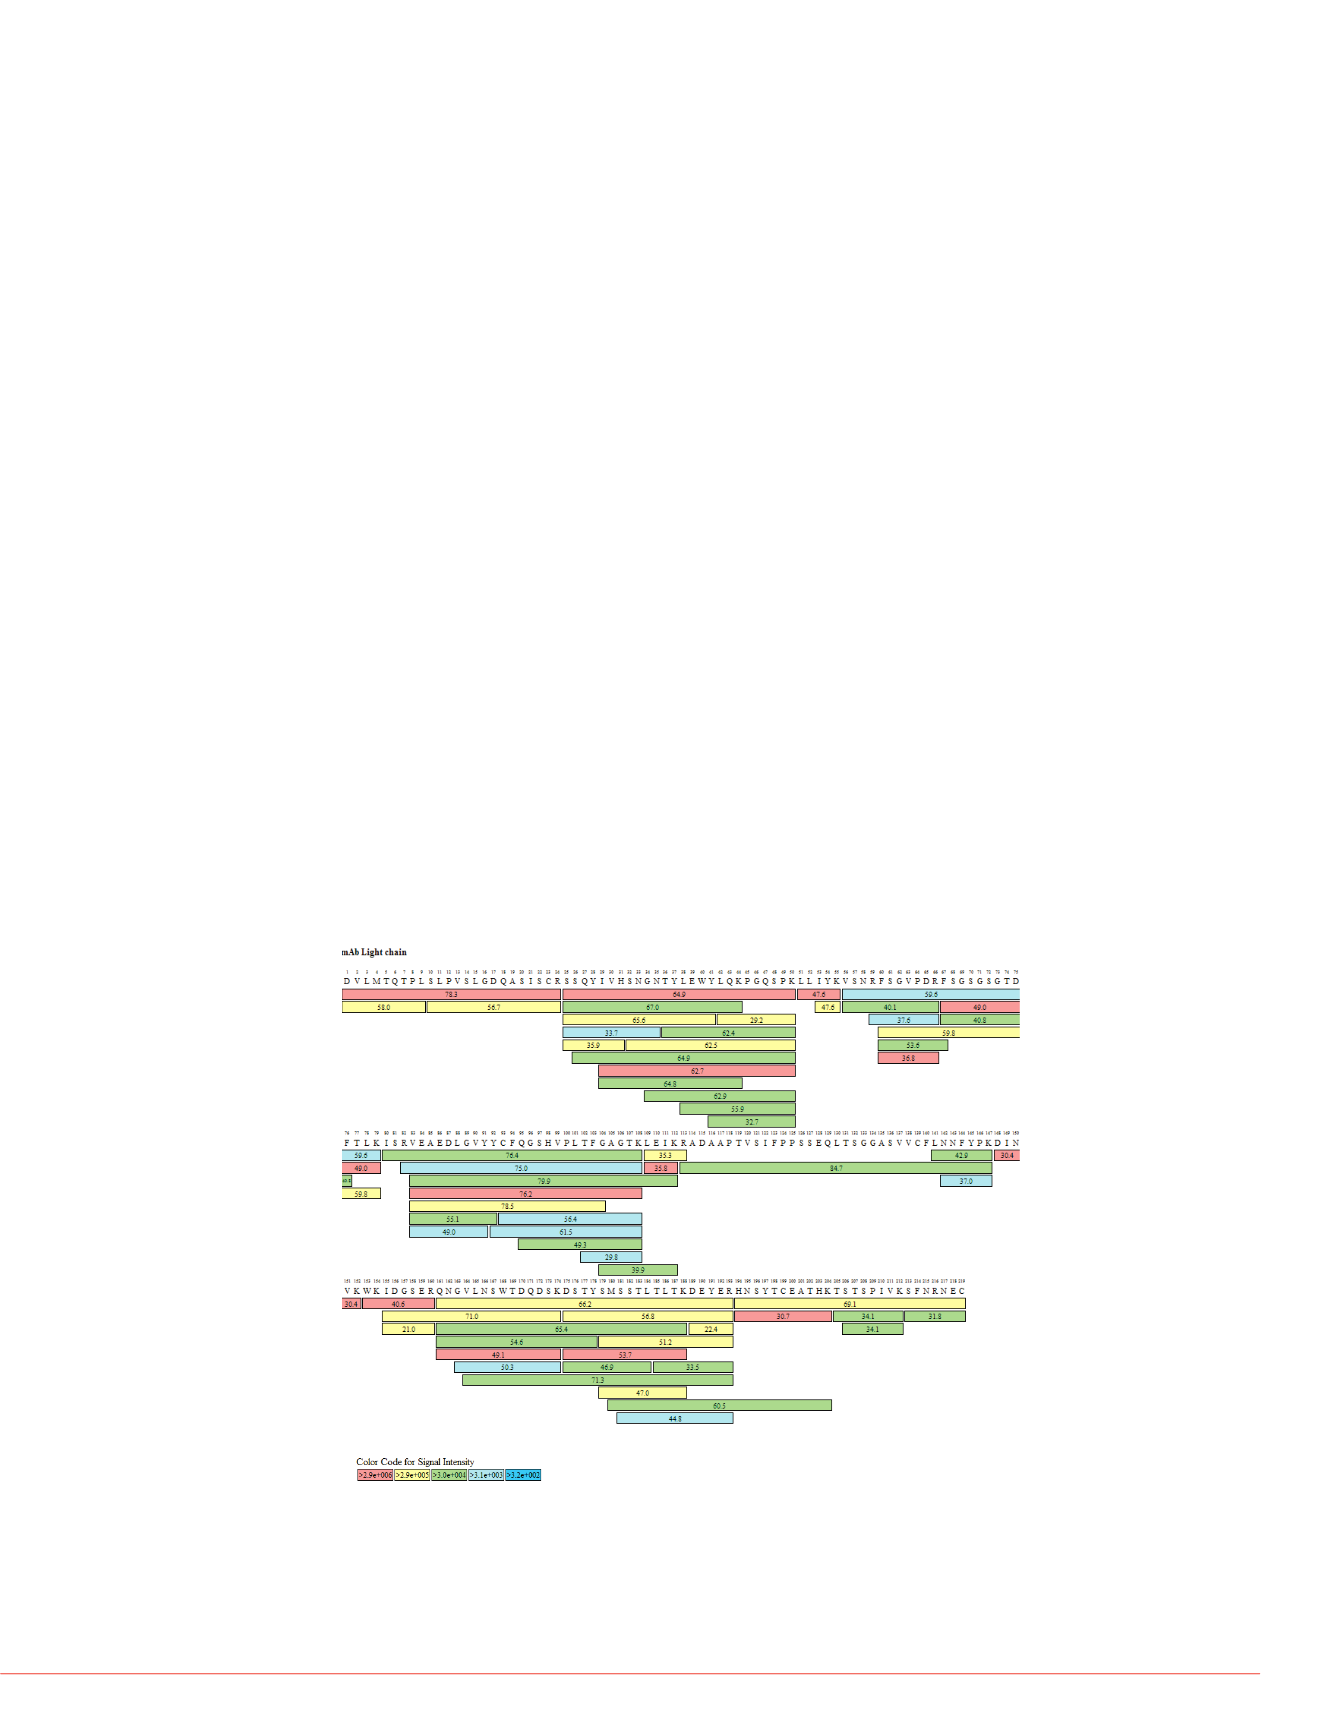
Sequence Characterization of IgG mAb
When the same IgG is further reduced and alkylated, sequence coverage of both IgG
light chain (Figure 3) and heavy chain are 100% and 97.1%, respectively. On the
sequence coverage map (Figures 2 and 3), most peptide sequences are mapped
multiple times indicating by different color bars below the sequence, which greatly
increases the identification confidence. The color bar represents signal intensity of
the identified peptide. The number within the bar is the retention time of eluting
peptide.
This data is comparable to the result generated by an overnight digestion protocol in
which IgG was denatured by guanidine, reduced by DTT and alkylated by IAA,
followed by trypsin digestion overnight (data not shown). The sample preparation
efficiency is significantly improved with Flash Digest kit.
G at Various Digestion Times
Relative
Abundance
15min
30
M49+Oxidation
9.67%
9.
~M49+Double
Oxidation
0.12%
0.
N60+Deamidatio
n
4.34%
5.
M304+Oxidation
15.35%
18.
M393+Oxidation
13.99%
14.
N292+A1G0F
15.48%
16.
N292+A1G1F
4.04%
4.
N292+A2G0F
34.82%
34.
N292+A2G1F
36.86%
36.
N292+A2G2F
7.57%
7.
Flash Digest is a trademark of Perfinity Bio
trademarks are the property of Thermo Fis
This information is not intended to encoura
intellectual property rights of others.
FIGURE 3. Sequence Coverage Map (100%) of Digested, Reduced and Alkylated
IgG Light Chain
ive, Non-reduced IgG Light
FIGURE 4. MS/MS Spectra of Tri
Predicted MS/MS Spectrum
Annotated Experimental MS/


