6
Broad Scope Pesticide Screening in Food Using Triple Quadrupole GC-MS
Conclusion
Two different ways of analyzing targeted and non-targeted compounds have been
demonstrated using the TSQ 8000 MS paired with the TRACE 1310 GC. Method 1
utilized the high SRM scan rate of the TSQ 8000 to scan for 600 pesticides in one
analytical run without sacrificing sensitivity. Without having to calibrate all 600
pesticides, an analyst can still identify additional pesticides that may appear in the
sample. Method 2 utilizes the ability of the TSQ 8000 to generate high quality library
searchable full scan spectra at high scan speeds by operating the instrument in
SRM/FS mode. This was done by selecting a number of target compounds for low level
SRM analysis, while using full scan to identify unknowns of any classification, such as
leachates from packaging, or nutritional compounds and preservatives added to food
products.
Listed below is a summary of the two methods.
Screening for 600 Pesticides
•
Screening for 600 pesticides without sacrificing sensitivity due to the high scan speed
of the TSQ 8000
•
52 compounds calibrated with R
2
> 0.98
•
Ability to identify pesticides not in the calibration through ion ratios
•
Customizable compound list using AutoSRM feature to optimize new compounds
Alternating SRM/FS
• Target large number of compounds while collecting full scan data
• Quantitate targeted compounds while looking for non-targeted compounds
• Unknown identification of non-targeted compounds using the NIST library
• Calibration curves for most pesticides were R
2
> 0.98
• Comparable MDLs with or without full scan data collection
• Can be used for identifying contamination from packaging, nutritional components, or
preservatives added to food products
• Customizable compound list using AutoSRM to optimize new compounds
© 2013 Thermo Fisher Scientific Inc. All rights reserved. Siltek is a registered trademark of Restek Corporation
.
All
other trademarks are the property of Thermo Fisher Scientific Inc and its subsidiaries. This information is not intended
to encourage use of these products in any manner that might infringe the intellectual property rights of others.
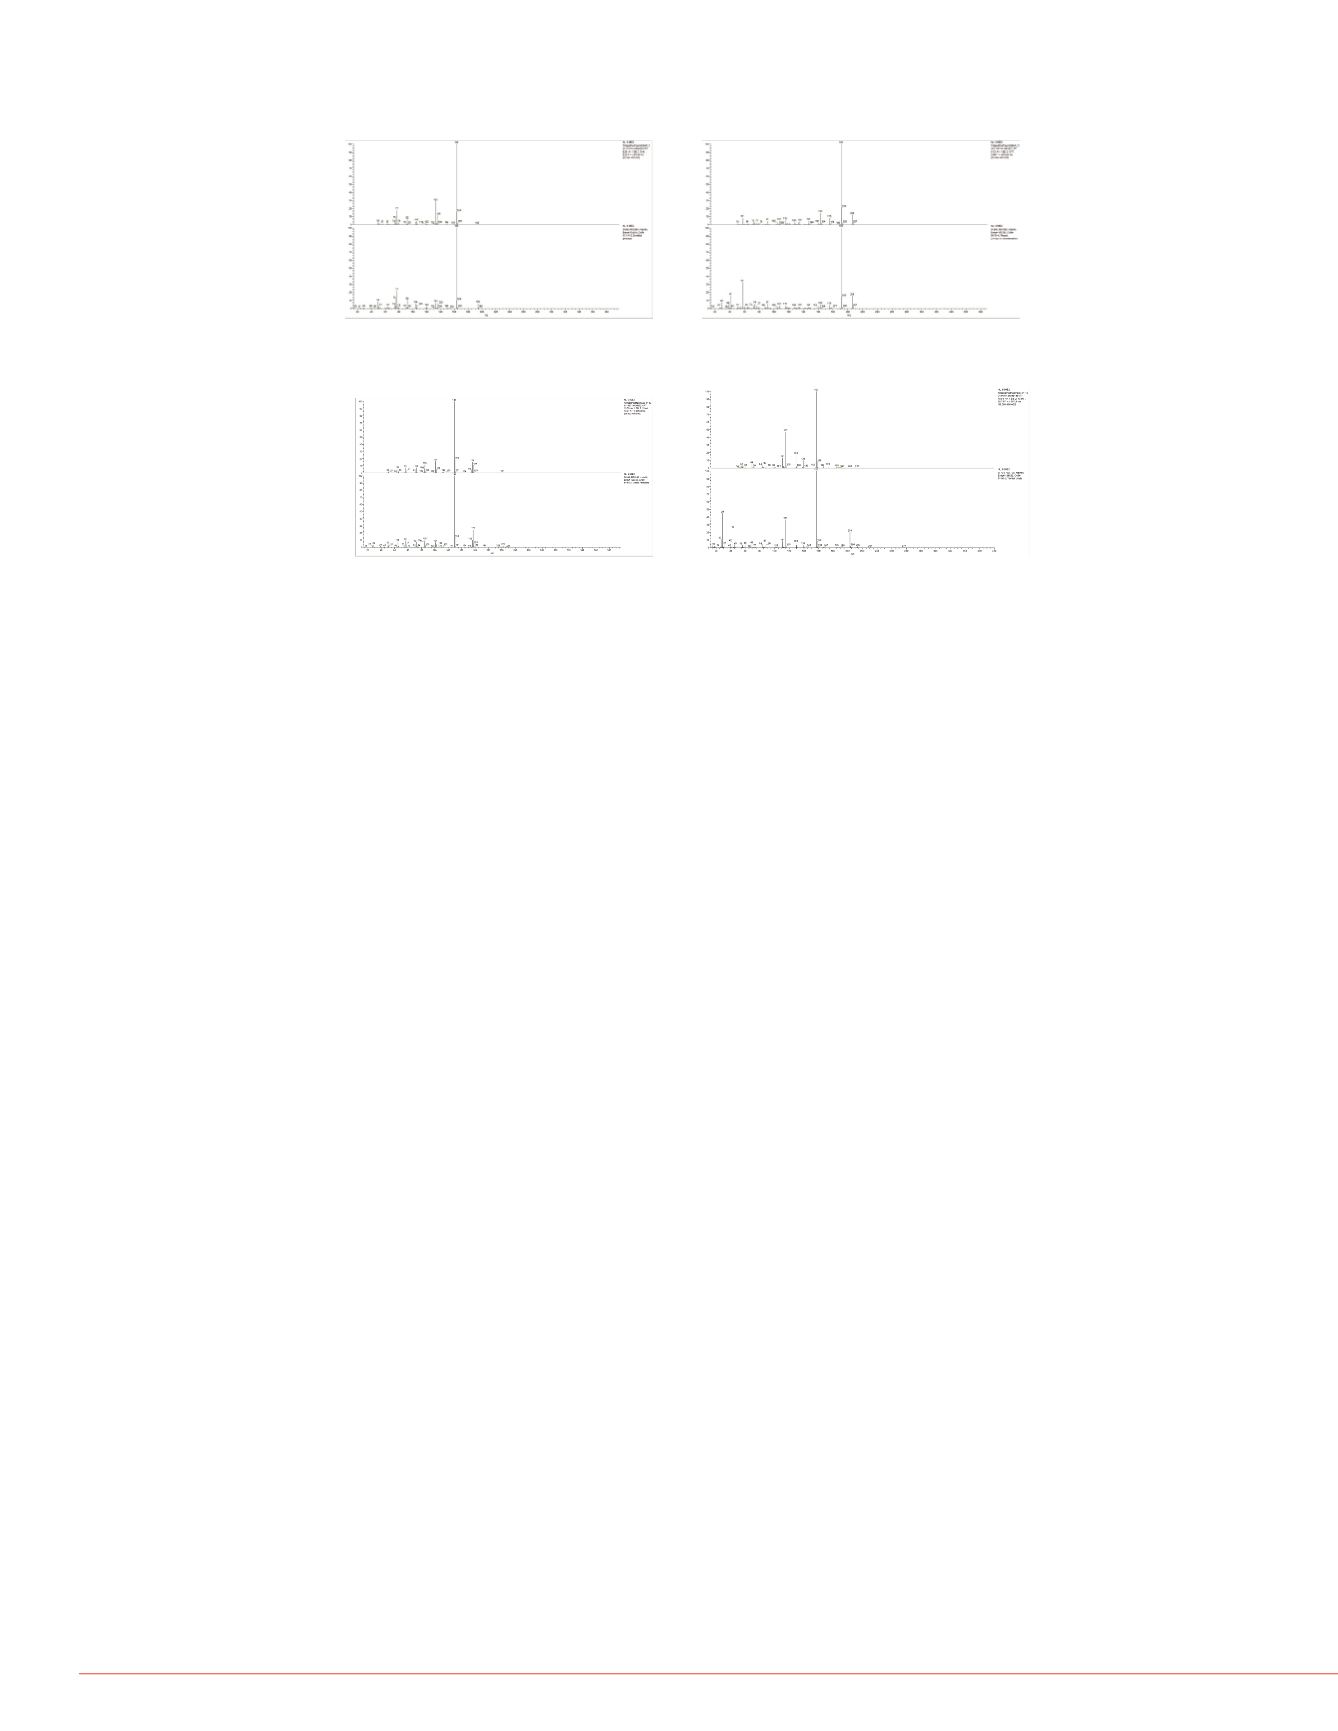
100 ppb Spiked Fruit Drink.
FIGURE 6. NIST Library Match for 4 Unknown Peaks.
RS method of extraction and
sticides were spiked into the
ppb. The calibration curves
ethods, SRM and alternating
f the compounds was R
2
>
ppb and 10 ppb standard in
for the two instrument
mparison of the MDLs of both
r with the full scan added to
FS analysis (ppb).
e SRM/FS instrument mode.
pm level. The full scan
pesticide spike. Peaks are at
rge saturated peak at 31.00
hown in Figure 5. Figure 6
d compounds.
Dimethyl phthalate at 9.29 min
Phenol, 2,4-bis (1,1-dimethylethyl) at 9.72 min
used as a UV stabilizer in plastics
Diethyl phthalate at10.39 min
Triethyl citrate at 0.91 min
used as a plasticizer and food additive


