3
Thermo Scienti c Poster Note
•
PN ASMS13_Th545_JCole_E 07/13S
geted and non-targeted
monitoring (SRM) mode or
SRM/FS) mode
nd non-targeted compounds
nabled more generic
ion of multiple analyte lists
multi-residue analysis in a
eted compounds increases,
tical performance becomes
d targeted lists for other
e use of smart instrument
analysis of 600 pesticides
ough MS duty cycle
ized targeted quantitation
Pesticides
extracted with 1:1 ethyl
xtraction and clean-up, then
:1). The concentrated
rds.
with both an SSL and PTV
liner was a Siltek™
3T2120). Chromatographic
ethyl polysiloxane column
rs for the PTV and oven.
Results
Quantitative performance was determined for 52 pesticides in lettuce matrix during the
screening for all 600 pesticides. The linearity for all of the compounds was R
2
> 0.98.
Curves were generated using Thermo Scientific™ TraceFinder™ software. Ten
replicates of a 40 ppb matrix spike sample were also analyzed. To test screening
capability, a few additional compounds were added to the 40 ppb spike which had not
been part of the calibration, but could be identified through the use of this method.
The average concentration and %RSD of the 40 ppb standard are given in Table 2.
Figure 5 shows the quantitation ions and confirming ions of the compounds in the 40
ppb spiked sample that were not a part of the original calibration. This demonstrates
the ability of the method and the instrument to identify targeted compounds in
samples for which the instrument is not calibrated.
A second method was generat
only 104 transitions. Ten replic
determine the MDLs for the two
the other containing only 104 tr
lettuce are shown in Figure 3.
times in the method with 104 tr
compounds is still capable of re
compounds requiring a targete
TABLE 2. 40 ppb Standard Spiked into Lettuce Matrix.
FIGURE 2. Pesticides Identifi
Curve. First Peak is the Qua
Mass Spectrometry
The targeted screening using SRM of 600 compounds was performed using the
Thermo Scientific™ TSQ™ 8000 triple quadrupole MS. After retention times were
determined in full scan, a timed-SRM method using selected reaction monitoring
(SRM) was constructed to analyze all compounds in a single injection. Over 1,300
transitions were entered into the method from the TSQ 8000 Pesticide Analyzer
Compound Database. This automatically populated both the processing and
instrument method through the TSQ 8000 system Method Synch. The transfer line
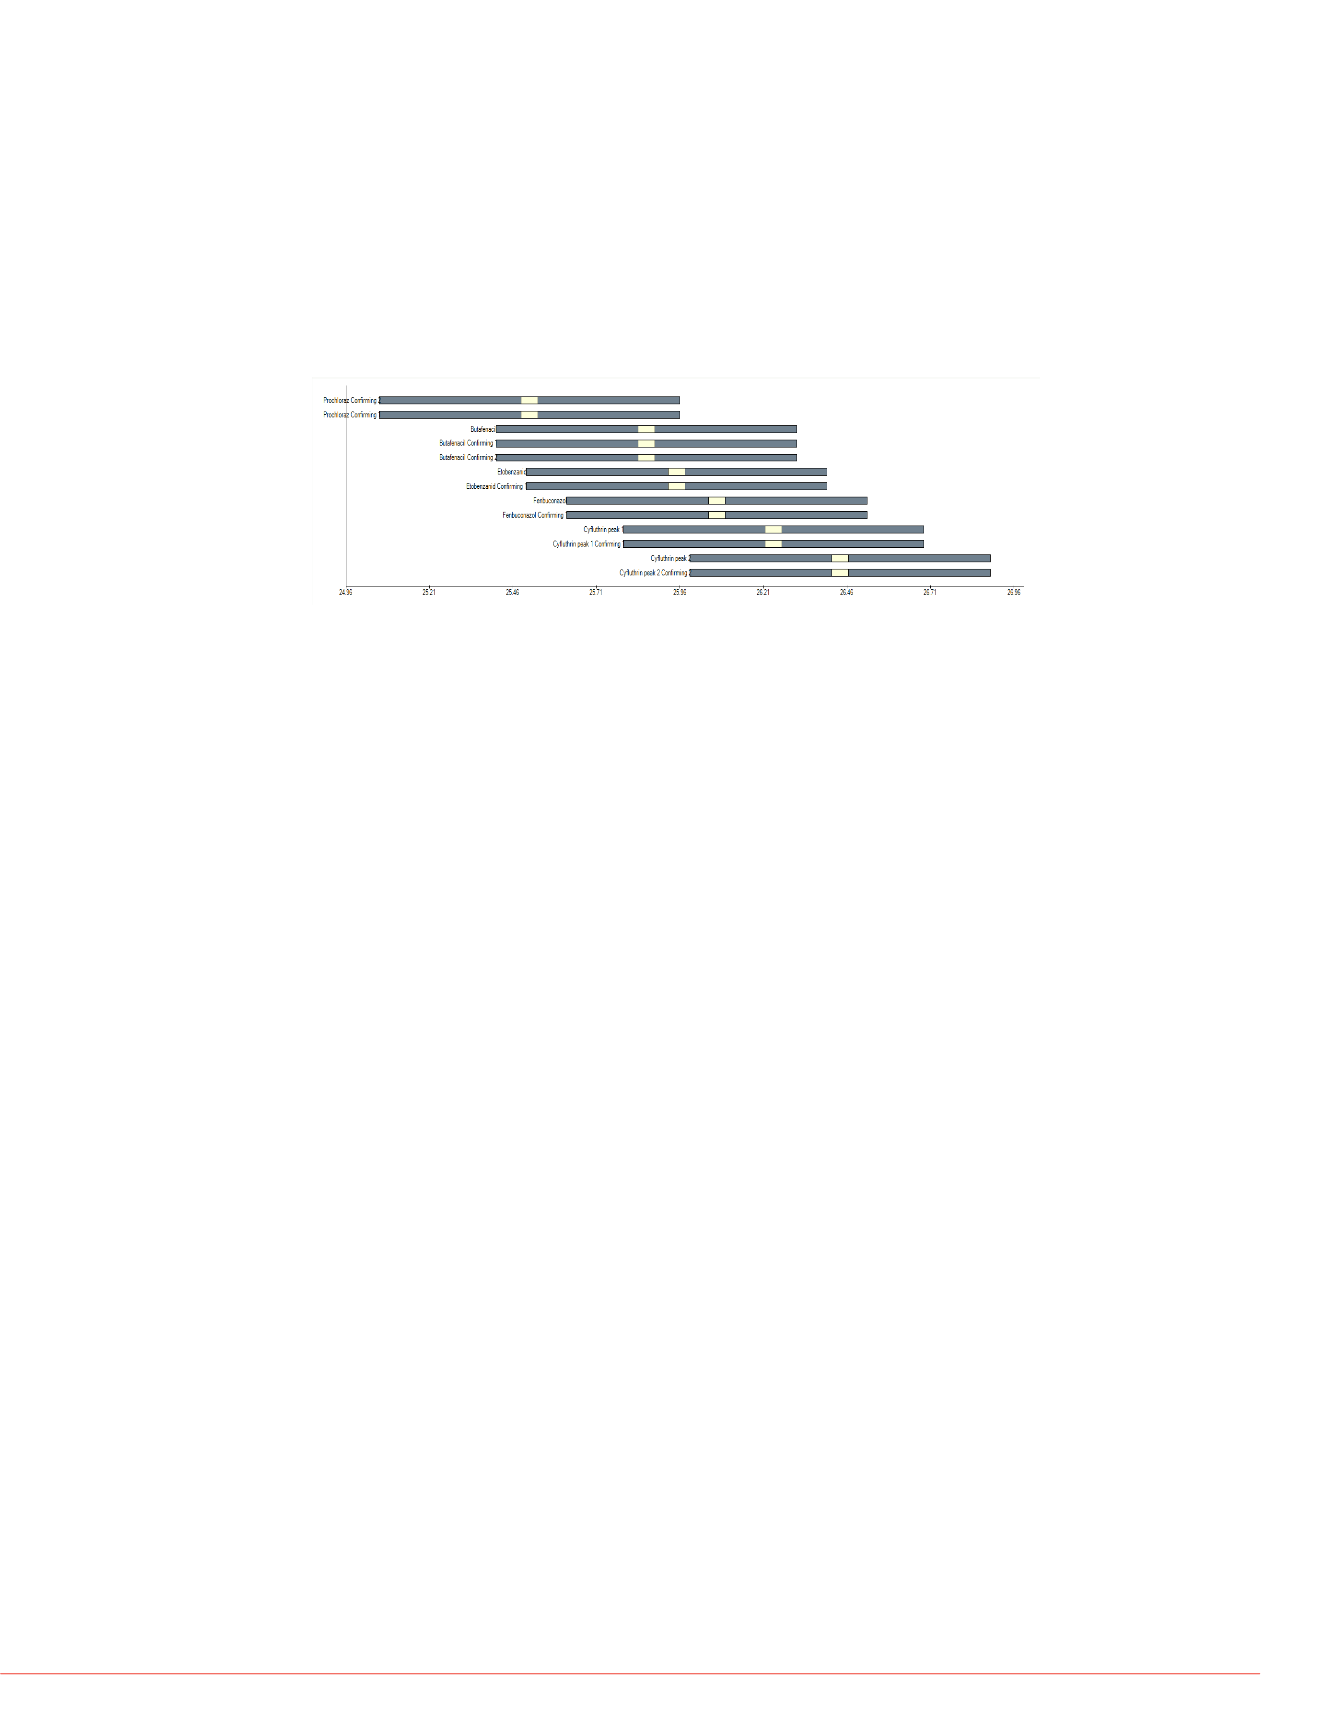
was set to 250 C, and the ion source was at 300 C. Figure 1 demonstrates timed-
SRM (t-SRM) which allows for the analysis of the 600 pesticides and provides for
good sensitivity.
FIGURE 1. Small Section of Timed-SRM.
Compound Name
Avg %RSD
Avg %RSD
Acibenzolar-S-methyl
32.1
8.8
Flutolanil
35.1
6.0
Azinphos-methyl
48.3
4.4
Fuberidazol
45.5
9.8
Azoxystrobin
39.5
2.3
Furalaxyl
62.4
4.4
Benalaxyl
43.8
6.3
Imazalil
45.6
3.5
Bendiocarb
50.7
3.9
Indoxacarb
47.2
9.2
Bitertanol
48.4
7.1
Isoprocarb
43.9
2.3
Boscalid (Nicobifen)
44.0
3.2
Mefenacet
47.1
2.9
Buprofezin
39.6
5.5
Metalaxyl
38.8
8.3
Carbaryl
56.1
2.3
Methiocarb
58.7
4.0
Carbofuran
45.1
11.8
Mevinphos
46.2
6.0
Carboxin
44.6
4.2
Oxadixyl
41.4
4.6
Carfentrazon-ethyl
39.1
5.4
Piperonyl butoxide
42.6
2.0
Clethodim
30.6
15.4
Pirimicarb
26.6 16.5
Cyprodinil
42.5
2.9
Propargite
55.9
6.5
Diethofencarb
41.2
6.7
Propham
40.2
1.7
Difenoconazole peak 1
53.7
3.0
Propiconazole peak 1
43.7 18.5
Difenoconazole peak 2
45.5
3.6
Propiconazole peak 2
49.3
6.0
Dimethomorph-1
52.8
7.1
Propoxur
46.9
2.1
Dimethomorph-2
49.7
3.2
Pyridaben
39.0
1.4
Ethofumesate
40.9
4.3
Pyrimethanil
37.5 15.3
Fenamidone
49.8
5.0
Spiromesifen
62.8
6.0
Fenbuconazol
40.7
1.2
Spiroxamine
52.3
7.0
Fenoxycarb
44.4
3.0
Thiabendazole
49.6
9.9
Flonicamid
44.7
6.1
Triazophos
46.7
4.3
Fludioxonil
45.2
5.7
Triflumizole
48.5 14.3
Flusilazole
44.8
6.1
Zoxamide
58.6
4.3
me Purge Flow
5.00
Flow
(mL/min)
50
75
e
FIGURE 3. Comparison of M
0
20
40
60
80
100
Bendiocarb
Isoprocarb
Oxadixyl
Acibenzolar-S-methyl
Fenamidone
Spiromesifen
Benalaxyl
Carbaryl
Diethofencarb
Parts per billion
Method 2 – Alte
Sample Preparation and Gas
The sample preparation and G
Mass Spectrometry
The scanning of 147 compound
quadrupole MS. After retention
method using selected reaction
147 compounds in a single inje
scan to the analysis.
3-Hydroxycarbofuran
Improvalicarb


