 
          4
        
        
          Broad Scope Pesticide Screening in Food Using Triple Quadrupole GC-MS
        
        
          ides in lettuce matrix during the
        
        
          he compounds was R
        
        
          2
        
        
          > 0.98.
        
        
          eFinder™ software.  Ten
        
        
          alyzed.  To test screening
        
        
          he 40 ppb spike which had not
        
        
          gh the use of this method.
        
        
          andard  are given in Table 2.
        
        
          s of the compounds in the 40
        
        
          alibration. This demonstrates
        
        
          targeted compounds in
        
        
          A second method was generated that targeted only the 52 compounds and contained
        
        
          only 104 transitions.  Ten replicates of a 5 ppb and 10 ppb standard were analyzed to
        
        
          determine the MDLs for the two instrument methods, one with 1300+ transitions, and
        
        
          the other containing only 104 transitions.  The results of compounds with MRLs for
        
        
          lettuce are shown in Figure 3.  Although lower detection limits result from longer dwell
        
        
          times in the method with 104 transitions,  the screening method that scans for 600
        
        
          compounds is still capable of reaching the limits in lettuce set by the EU for the
        
        
          compounds requiring a targeted analysis in our list.


            ix.


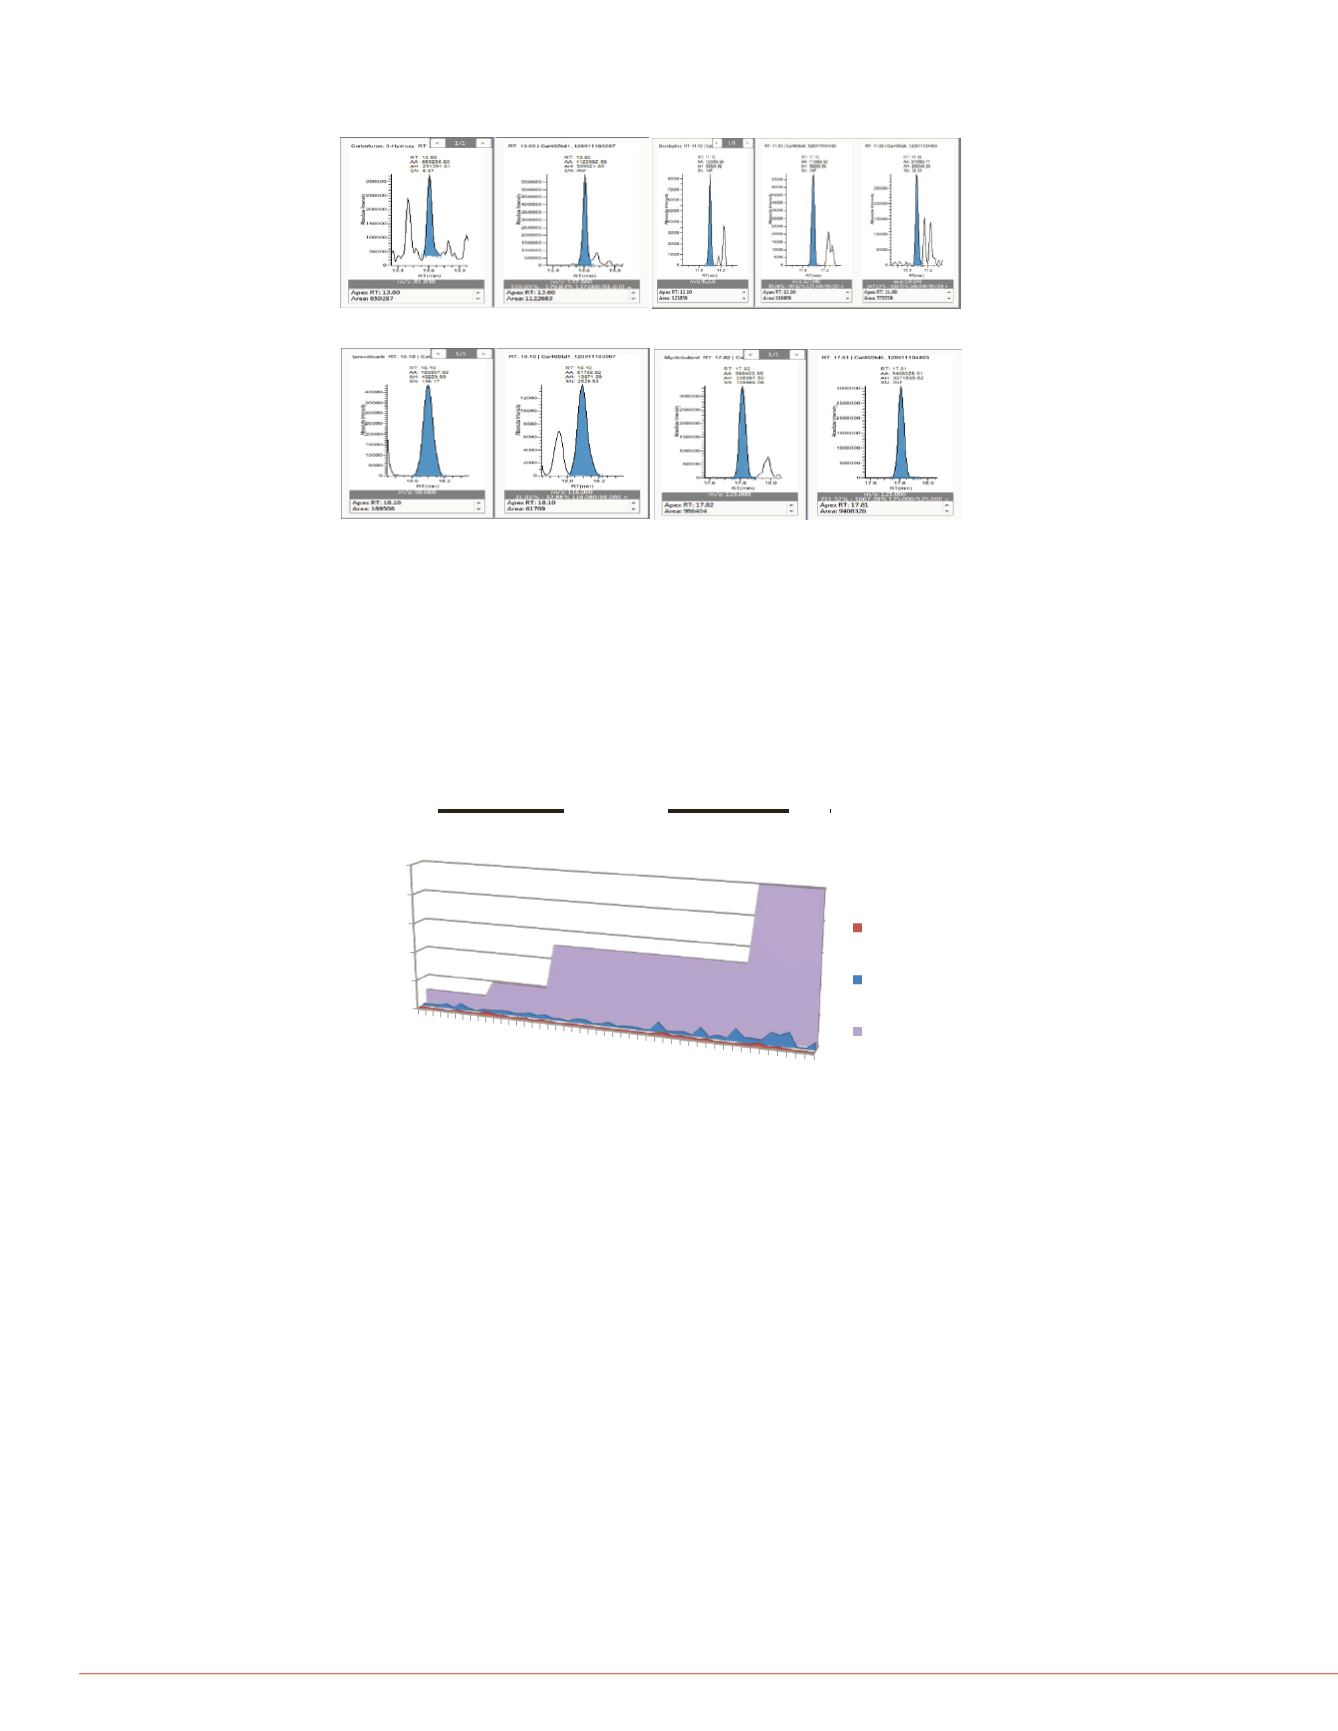
            FIGURE 2.  Pesticides Identified by Ion Ratio Not in the Targeted Calibration


            Curve.  First Peak is the Quan Peak, and the Others are for Confirmation.


            FIGURE 5. Close-up View o


          was performed using the
        
        
          .  After retention times were
        
        
          lected reaction monitoring
        
        
          single injection. Over 1,300
        
        
          8000 Pesticide Analyzer
        
        
          th the processing and
        
        
          hod Synch.  The transfer line
        
        
          Figure 1 demonstrates timed-
        
        
          pesticides and provides for


            Avg %RSD


          35.1
        
        
          6.0
        
        
          45.5
        
        
          9.8
        
        
          62.4
        
        
          4.4
        
        
          45.6
        
        
          3.5
        
        
          47.2
        
        
          9.2
        
        
          43.9
        
        
          2.3
        
        
          47.1
        
        
          2.9
        
        
          38.8
        
        
          8.3
        
        
          58.7
        
        
          4.0
        
        
          46.2
        
        
          6.0
        
        
          41.4
        
        
          4.6
        
        
          e
        
        
          42.6
        
        
          2.0
        
        
          26.6 16.5
        
        
          55.9
        
        
          6.5
        
        
          40.2
        
        
          1.7
        
        
          eak 1
        
        
          43.7 18.5
        
        
          eak 2
        
        
          49.3
        
        
          6.0
        
        
          46.9
        
        
          2.1
        
        
          39.0
        
        
          1.4
        
        
          37.5 15.3
        
        
          62.8
        
        
          6.0
        
        
          52.3
        
        
          7.0
        
        
          49.6
        
        
          9.9
        
        
          46.7
        
        
          4.3
        
        
          48.5 14.3
        
        
          58.6
        
        
          4.3


            FIGURE 3. Comparison of MDLs: 52 Compounds vs. 600 Compounds.


          0
        
        
          20
        
        
          40
        
        
          60
        
        
          80
        
        
          100
        
        
          Bendiocarb
        
        
          Isoprocarb
        
        
          Oxadixyl
        
        
          Acibenzolar-S-methyl
        
        
          Fenamidone
        
        
          Spiromesifen
        
        
          Benalaxyl
        
        
          Carbaryl
        
        
          Diethofencarb
        
        
          Ethofumesate
        
        
          Flonicamid
        
        
          Fuberidazol
        
        
          Propham
        
        
          Pyrimethanil
        
        
          Methiocarb
        
        
          Triflumizole
        
        
          Pirimicarb


            Parts per billion


          50 Pesticides Method
        
        
          LOD
        
        
          600 Pesticides Method
        
        
          LOD
        
        
          EU MRL


            Method 2 – Alternating SRM/FS


            Sample Preparation and Gas Chromatography


          The sample preparation and GC parameters remained the same as in the first study.


            Mass Spectrometry


          The scanning of 147 compounds was performed using the TSQ 8000 triple
        
        
          quadrupole MS.  After retention times were determined in full scan, a timed-SRM
        
        
          method using selected reaction monitoring (SRM) was constructed to analyze all
        
        
          147 compounds in a single injection.  A second method was constructed, adding full
        
        
          scan to the analysis.


            Results


          A sample of fruit drink was ex
        
        
          cleanup.  The extract was co
        
        
          extract to produce calibration
        
        
          were constructed  using Trac
        
        
          SRM/full scan for 147 pestici
        
        
          0.98 for both methods of anal
        
        
          fruit juice extract were analyz
        
        
          methods, SRM only and alter
        
        
          methods are shown in Figure
        
        
          the instrument method, but v


            FIGURE 4. Comparison of


          Fruit drink was spiked at 100
        
        
          This extract was also spiked
        
        
          chromatogram shows several
        
        
          retention times of 9.29, 9.73,
        
        
          minutes. A close-up view of t
        
        
          displays the  NIST library mat
        
        
          3-Hydroxycarbofuran
        
        
          Dicrotophos
        
        
          Improvalicarb
        
        
          Myclobutanil