 
          4
        
        
          Comparing LC and GC Triple Quadrupole MS for the Screening of 500 Pesticides in Matrix


            TSQ Quantum Access MAX


          All samples were analyzed on
        
        
          triple stage quadrupole mass
        
        
          (HESI) source. To maximize th
        
        
          SRM windows were employed
        
        
          addition, Quantitation-Enhanc
        
        
          triggered MS/MS data, was us
        
        
          negative polarity switching wa
        
        
          Figure 6 below.


            LC/MS Instrument  Methodology


          U-HPLC Method Conditions
        
        
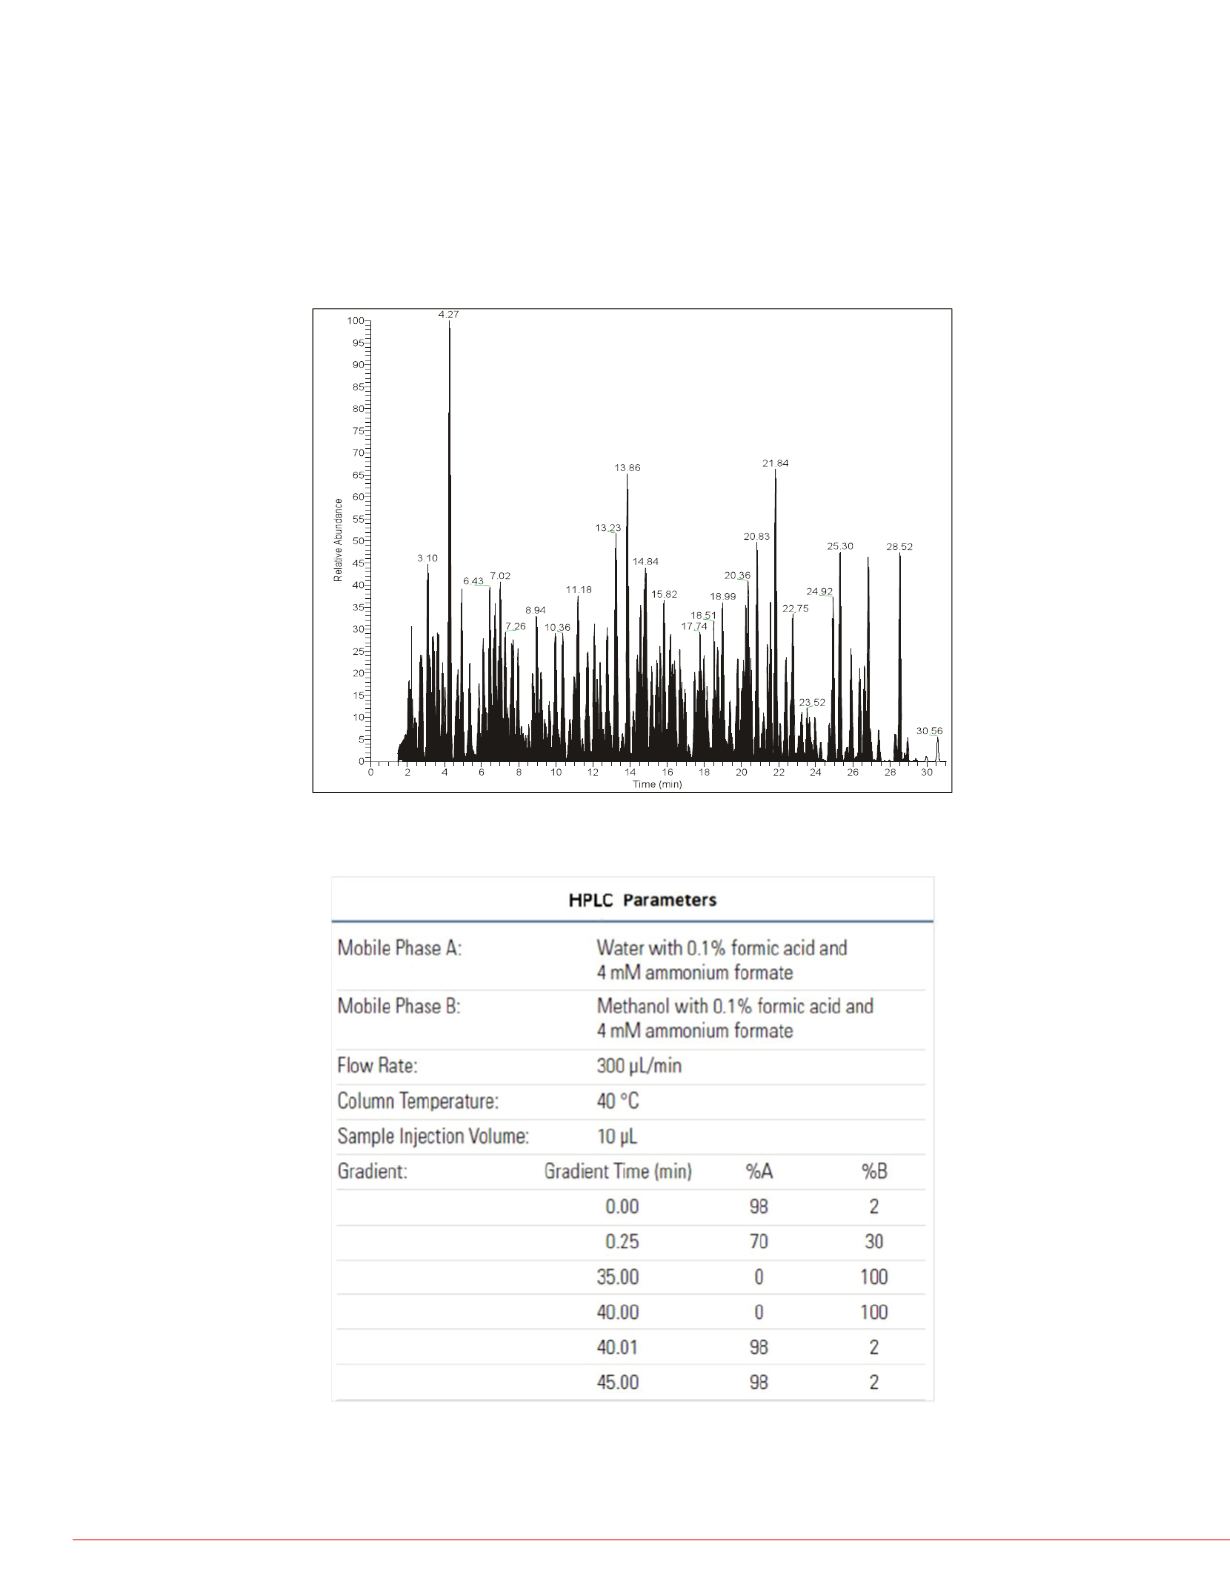
          Chromatographic analysis was performed using the Thermo Scientific™ Accela™
        
        
          1250 UHPLC system. The autosampler was an HTC-PAL™ Autosampler (CTC
        
        
          Analytics, Zwingen, Switzerland). The column used was a Thermo Scientific
        
        
          ™
        
        
          Hypersil
        
        
          ™
        
        
          GOLD aQ column (100 x 2.1 mm, 1.9 µm particle size). Displayed in Figure
        
        
          4 is the total ion chromatogram. The UHPLC conditions are listed in Figure 5.


            FIGURE 5. HPLC Parameters


            Results and Di


            Determination of Method De


          For both GC/MS and LC/MS
        
        
          several concentrations close t
        
        
          (EU MRL). Each concentration
        
        
          determination
        
        
          2
        
        
          of the method
        
        
          MRL for an onion matrix for ea
        
        
          for the pesticide in onion, a 10
        
        
          regulations.


            Comparison of GC/MS to LC


          The majority of compounds w
        
        
          LC/MS method used (Figure 7
        
        
          pesticides had MDLs less than
        
        
          432 pesticides with MDLs belo
        
        
          a10 µL injection was used in t
        
        
          employed in the GC/MS meth


            FIGURE 7. Number of comp


            MRLs for GC/MS and LC/MS


          rmo Scientific™ TSQ 8000
        
        
          developed with the use of
        
        
          development with collision
        
        
          Finder™ software was used for
        
        
          Selecting the appropriate
        
        
          populated the SRM acquisition
        
        
          essing parameters in the
        
        
          ing method. One ion per
        
        
          al ions were used for ion ratio
        
        
          s used.


            FIGURE 6. LC-Mass Spectro


            FIGURE 4. LC/MS Total Ion Chromatogram


          TraceGOLD™ TG-5SILMS,
        
        
          r employed was a baffled,