5
Thermo Scienti c Poster Note
•
PN ASMS13_Th544_JCole_E 07/13S
TSQ Quantum Access MAX LC-Triple Quadrupole Method Conditions
All samples were analyzed on the Thermo Scientific™ TSQ Quantum Access MAX™
triple stage quadrupole mass spectrometer with a heated electrospray ionization
(HESI) source. To maximize the performance of the mass spectrometer, time-specific
SRM windows were employed at the retention times of the target compounds. In
addition, Quantitation-Enhanced Data-Dependent scanning, which delivers SRM-
triggered MS/MS data, was used for structural confirmation. Alternating positive and
negative polarity switching was utilized in the method. The MS conditions are listed in
Figure 6 below.
Conclusion
Methodology for both GC and L
500 pesticides in a food matrix e
results, conclusions and possibl
372 of 524 total pesticides
samples by GC/MS
432 of 524 were detected
516 of 524 were detected
LC/MS, demonstrating the
For future work, a 10 µL la
GC/MS methodology to b
to lower the eight problem
Also, future work could ex
the eight problematic com
heavily for these compoun
trading selectivity for sens
References
1. Steven J. Lehotay, Quick,
(QuEChERs) Approach for Dete
Biotechnology, 2006, 19, 239-26
2.
/
Siltek is a registered trademark of Restek
other trademarks are the property of Ther
This information is not intended to encoura
intellectual property rights of others.
Scientific™ Accela™
Autosampler (CTC
hermo Scientific
™
size). Displayed in Figure
listed in Figure 5.
FIGURE 8. Number of pesticid
GC/LC combined methodolog
separately. Also displayed are
for both GC and LC methodol
Results and Discussion
Determination of Method Detection Limit
For both GC/MS and LC/MS methods, spiked matrix samples were analyzed at
several concentrations close to or below the European Union Method Reporting Limit
(EU MRL). Each concentration level was injected several times and a statistical
determination
2
of the method detection limit was calculated for comparison to the EU
MRL for an onion matrix for each pesticide. When a required MRL was not available
for the pesticide in onion, a 10 parts per billion MRL was used as stated in EU
regulations.
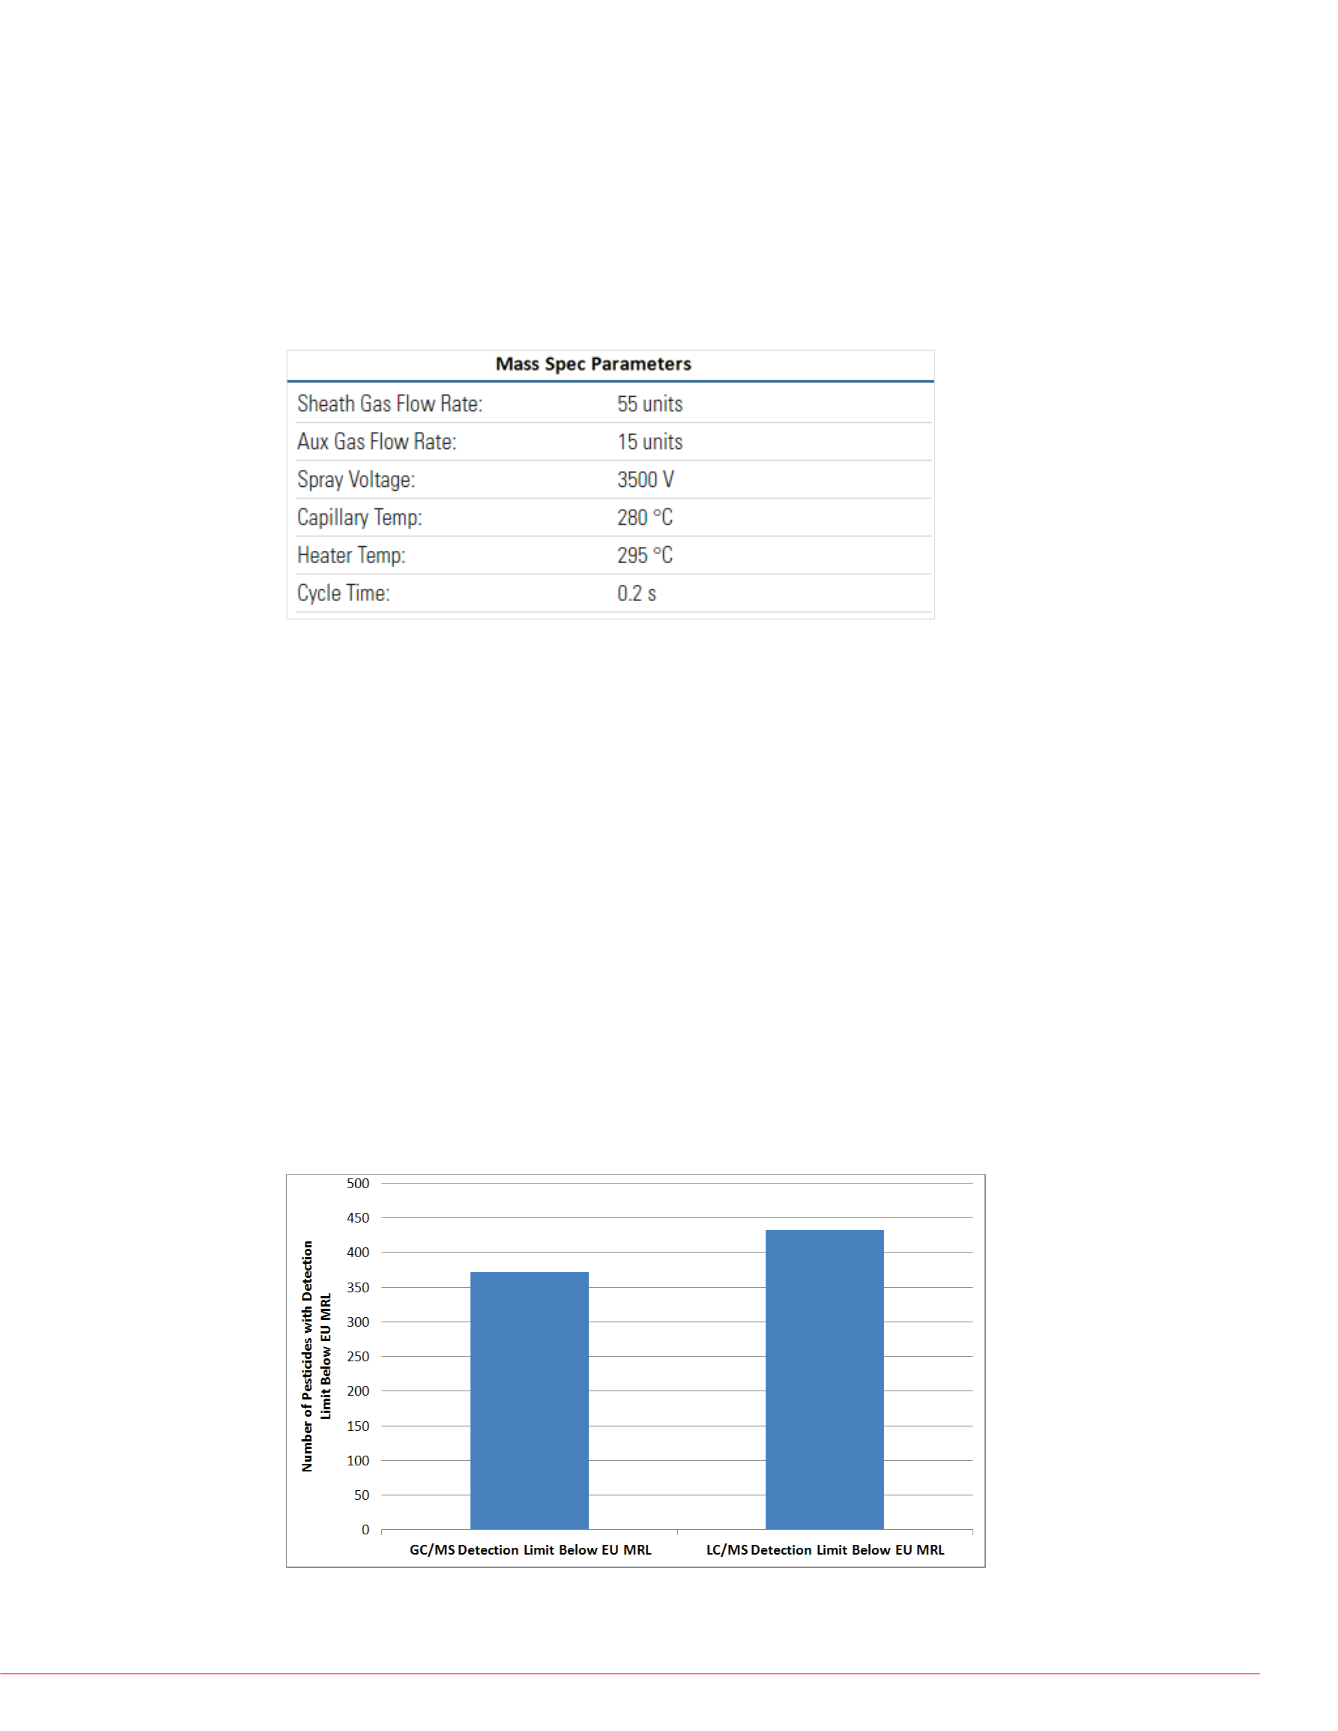
Comparison of GC/MS to LC/MS
The majority of compounds were detected below EU MRLs by either the GC/MS or
LC/MS method used (Figure 7). Out of the total 524 compounds analyzed, 372
pesticides had MDLs less than EU MRLs for the GC/MS methodology, compared with
432 pesticides with MDLs below the EU MRLs for the LC/MS methodology. Note that
a10 µL injection was used in the LC/MS methodology compared with a 1 µL injection
employed in the GC/MS methodology.
FIGURE 7. Number of compounds with method detection limits lower than EU
MRLs for GC/MS and LC/MS methods
FIGURE 6. LC-Mass Spectrometer Parameters.
Benefits of Comprehensive G
By combining both GC and LC
methodology, 516 pesticides we
is 144 more than were detected
84 more than by LC/MS alone.
both GC/MS and LC/MS greater
compounds” detection limits wer
gave them their lowest detection
Furthermore, 288 compounds w
EU MRL by both GC/MS and LC
these pesticides the two orthogo
confidence in the identification a
results.


