6
Comparing LC and GC Triple Quadrupole MS for the Screening of 500 Pesticides in Matrix
thod Conditions
Q Quantum Access MAX™
electrospray ionization
spectrometer, time-specific
e target compounds. In
ng, which delivers SRM-
n. Alternating positive and
e MS conditions are listed in
Conclusion
Methodology for both GC and LC/MS was developed and employed to analyze over
500 pesticides in a food matrix extracted with QuEChERS methodology. A summary of
results, conclusions and possible future investigations for this project are as follow:
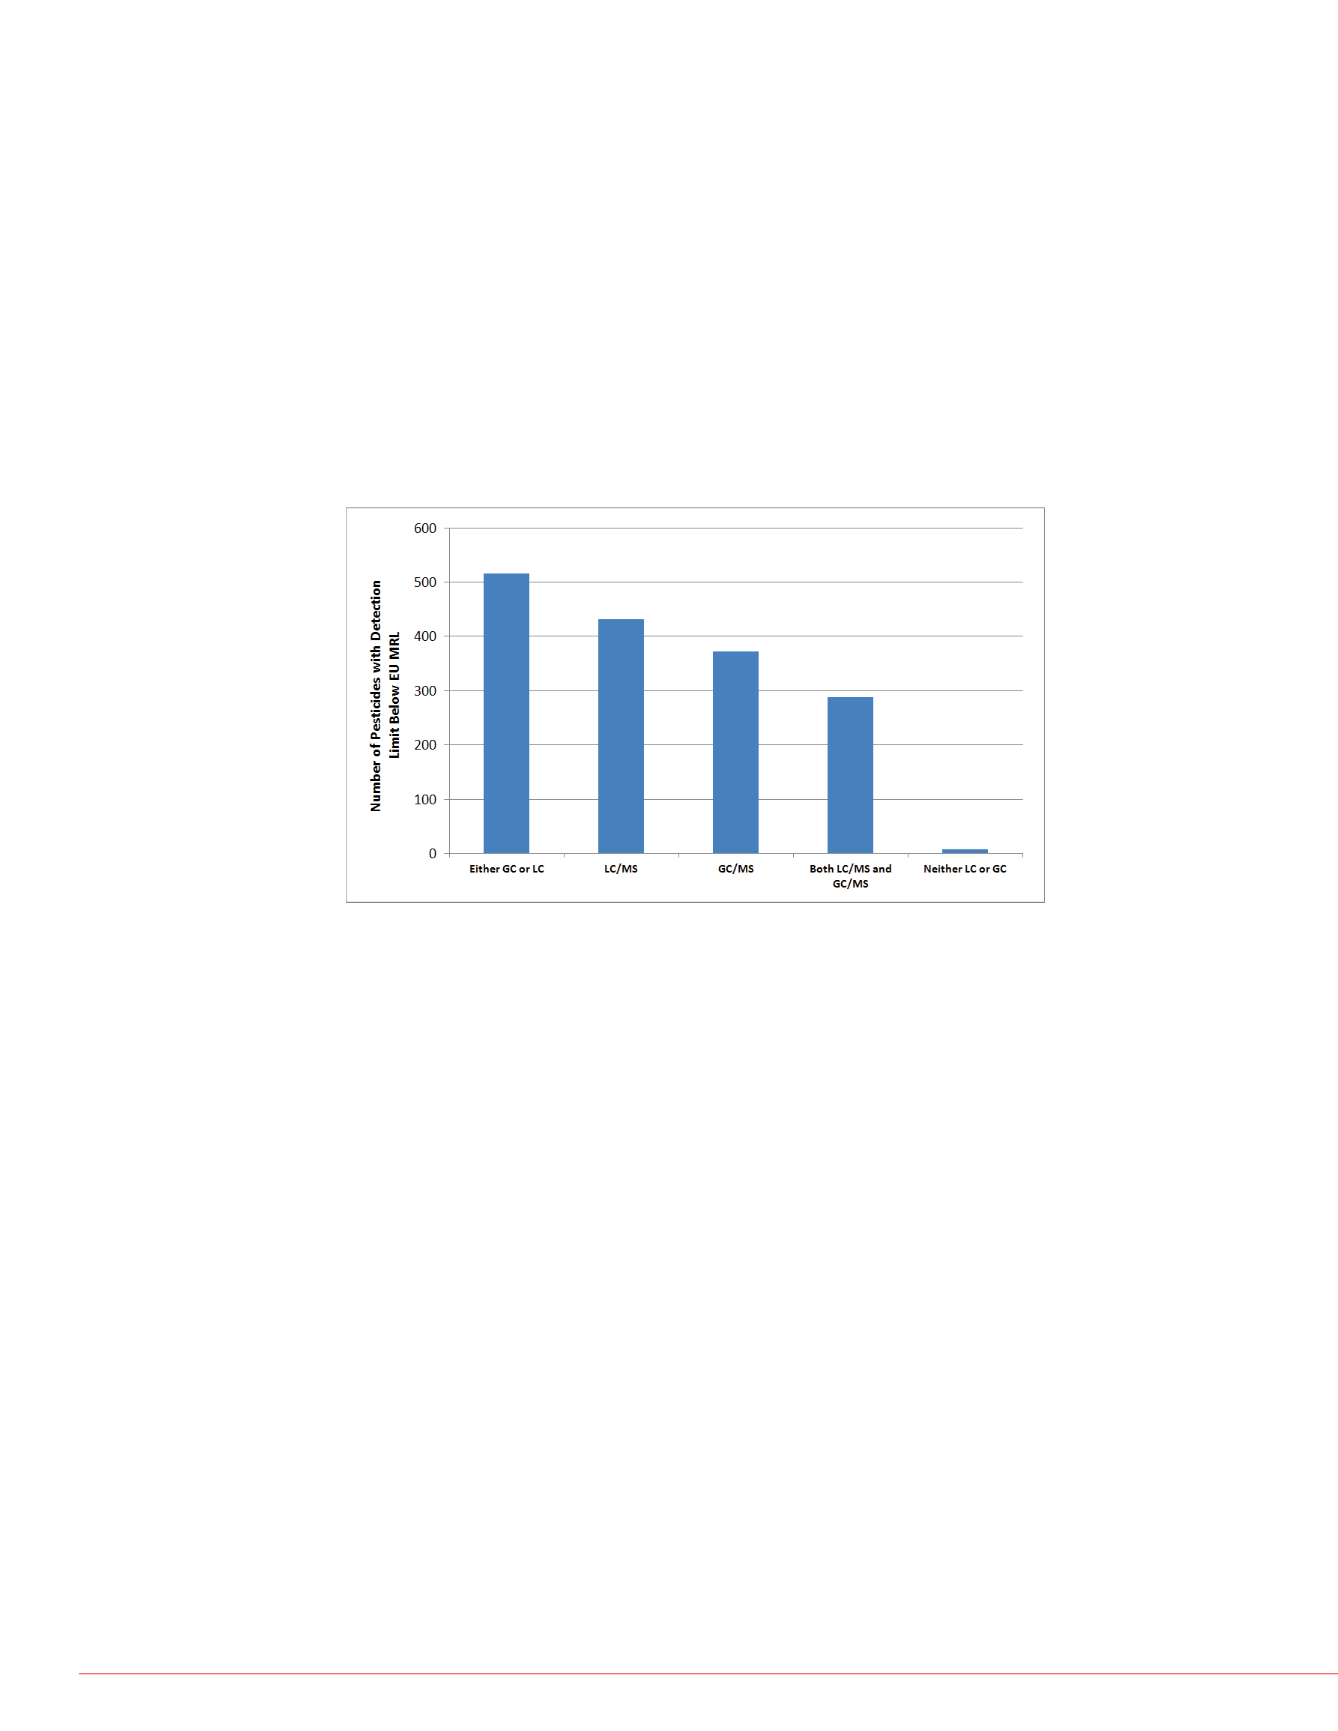
372 of 524 total pesticides were detected at levels under EU MRLs for onion
samples by GC/MS
432 of 524 were detected at levels under EU MRLs for onion samples by LC/MS
516 of 524 were detected by either GC/MS, LC/MS, or by both GC/MS and
LC/MS, demonstrating the power of combining these two techniques.
For future work, a 10 µL large volume GC injection could be employed for the
GC/MS methodology to better compare with the LC/MS methodology, and to try
to lower the eight problematic pesticides detection limits under the EU MRL.
Also, future work could explore techniques to selectively increase sensitivity for
the eight problematic compounds, such as weighting SRM dwell time more
heavily for these compounds, or decreasing resolution for these compounds,
trading selectivity for sensitivity.
References
1. Steven J. Lehotay, Quick, Easy, Cheap, Effective, Rugged and Safe
(QuEChERs) Approach for Determining Pesticide Residues. Methods in
Biotechnology, 2006, 19, 239-261.
2.
Siltek is a registered trademark of Restek Corporation. PAL is a registered trademark of CTC Analytics AG. All
other trademarks are the property of Thermo Fisher Scientific and its subsidiaries.
This information is not intended to encourage use of these products in any manners that might infringe the
intellectual property rights of others.
FIGURE 8. Number of pesticides with detection limits below the EU MRL for
GC/LC combined methodology compared with LC and GC methodology
separately. Also displayed are numbers of pesticides detected below the MRL
for both GC and LC methodology, and by neither methodology.
ples were analyzed at
nion Method Reporting Limit
times and a statistical
d for comparison to the EU
ired MRL was not available
used as stated in EU
Ls by either the GC/MS or
pounds analyzed, 372
methodology, compared with
/MS methodology. Note that
pared with a 1 µL injection
tion limits lower than EU
Benefits of Comprehensive GC/LC Methodology
By combining both GC and LC methodologies in a comprehensive screening
methodology, 516 pesticides were detected below their MRLs for an onion matrix. This
is 144 more than were detected below their MRLs for GC/MS methodology alone, and
84 more than by LC/MS alone. Only 8 pesticides had calculated detection limits for
both GC/MS and LC/MS greater than their EU MRLs. On average, these 8
compounds” detection limits were four times their EU MRLs for the technique that
gave them their lowest detection limit.
Furthermore, 288 compounds were able to be detected at concentrations below the
EU MRL by both GC/MS and LC/MS methodology. This indicates that for a majority of
these pesticides the two orthogonal techniques can be used together to increase
confidence in the identification and quantitation. Figure 8 displayed below details these
results.


