5
Thermo Scienti c Poster Note
•
PN ASMS13_Th545_JCole_E 07/13S
Conclusion
Two different ways of analyzing t
demonstrated using the TSQ 80
utilized the high SRM scan rate
analytical run without sacrificing
pesticides, an analyst can still id
sample. Method 2 utilizes the a
searchable full scan spectra at h
SRM/FS mode. This was done b
SRM analysis, while using full sc
leachates from packaging, or nu
products.
Listed below is a summary of th
Screening for 600 Pesticides
•
Screening for 600 pesticides
of the TSQ 8000
•
52 compounds calibrated with
•
Ability to identify pesticides no
•
Customizable compound list u
Alternating SRM/FS
• Target large number of compo
• Quantitate targeted compound
• Unknown identification of non-
• Calibration curves for most pe
• Comparable MDLs with or wit
• Can be used for identifying co
preservatives added to food p
• Customizable compound list u
compounds and contained
tandard were analyzed to
ith 1300+ transitions, and
pounds with MRLs for
its result from longer dwell
hod that scans for 600
et by the EU for the
© 2013 Thermo Fisher Scientific Inc. All ri
other trademarks are the property of Ther
to encourage use of these products in any
Targeted Calibration
for Confirmation.
FIGURE 5. Close-up View of Four Unknown Peaks in 100 ppb Spiked Fruit Drink.
FIGURE 6. NIST Library Match
0 Compounds.
50 Pesticides Method
LOD
600 Pesticides Method
LOD
EU MRL
S
ame as in the first study.
SQ 8000 triple
ll scan, a timed-SRM
tructed to analyze all
constructed, adding full
Results
A sample of fruit drink was extracted using the QuEChERS method of extraction and
cleanup. The extract was concentrated 5x, then 147 pesticides were spiked into the
extract to produce calibration curves from 1 ppb to 200 ppb. The calibration curves
were constructed using TraceFinder software for both methods, SRM and alternating
SRM/full scan for 147 pesticides. The linearity for most of the compounds was R
2
>
0.98 for both methods of analysis. Ten replicates of a 1 ppb and 10 ppb standard in
fruit juice extract were analyzed to determine the MDLs for the two instrument
methods, SRM only and alternating SRM/full scan A comparison of the MDLs of both
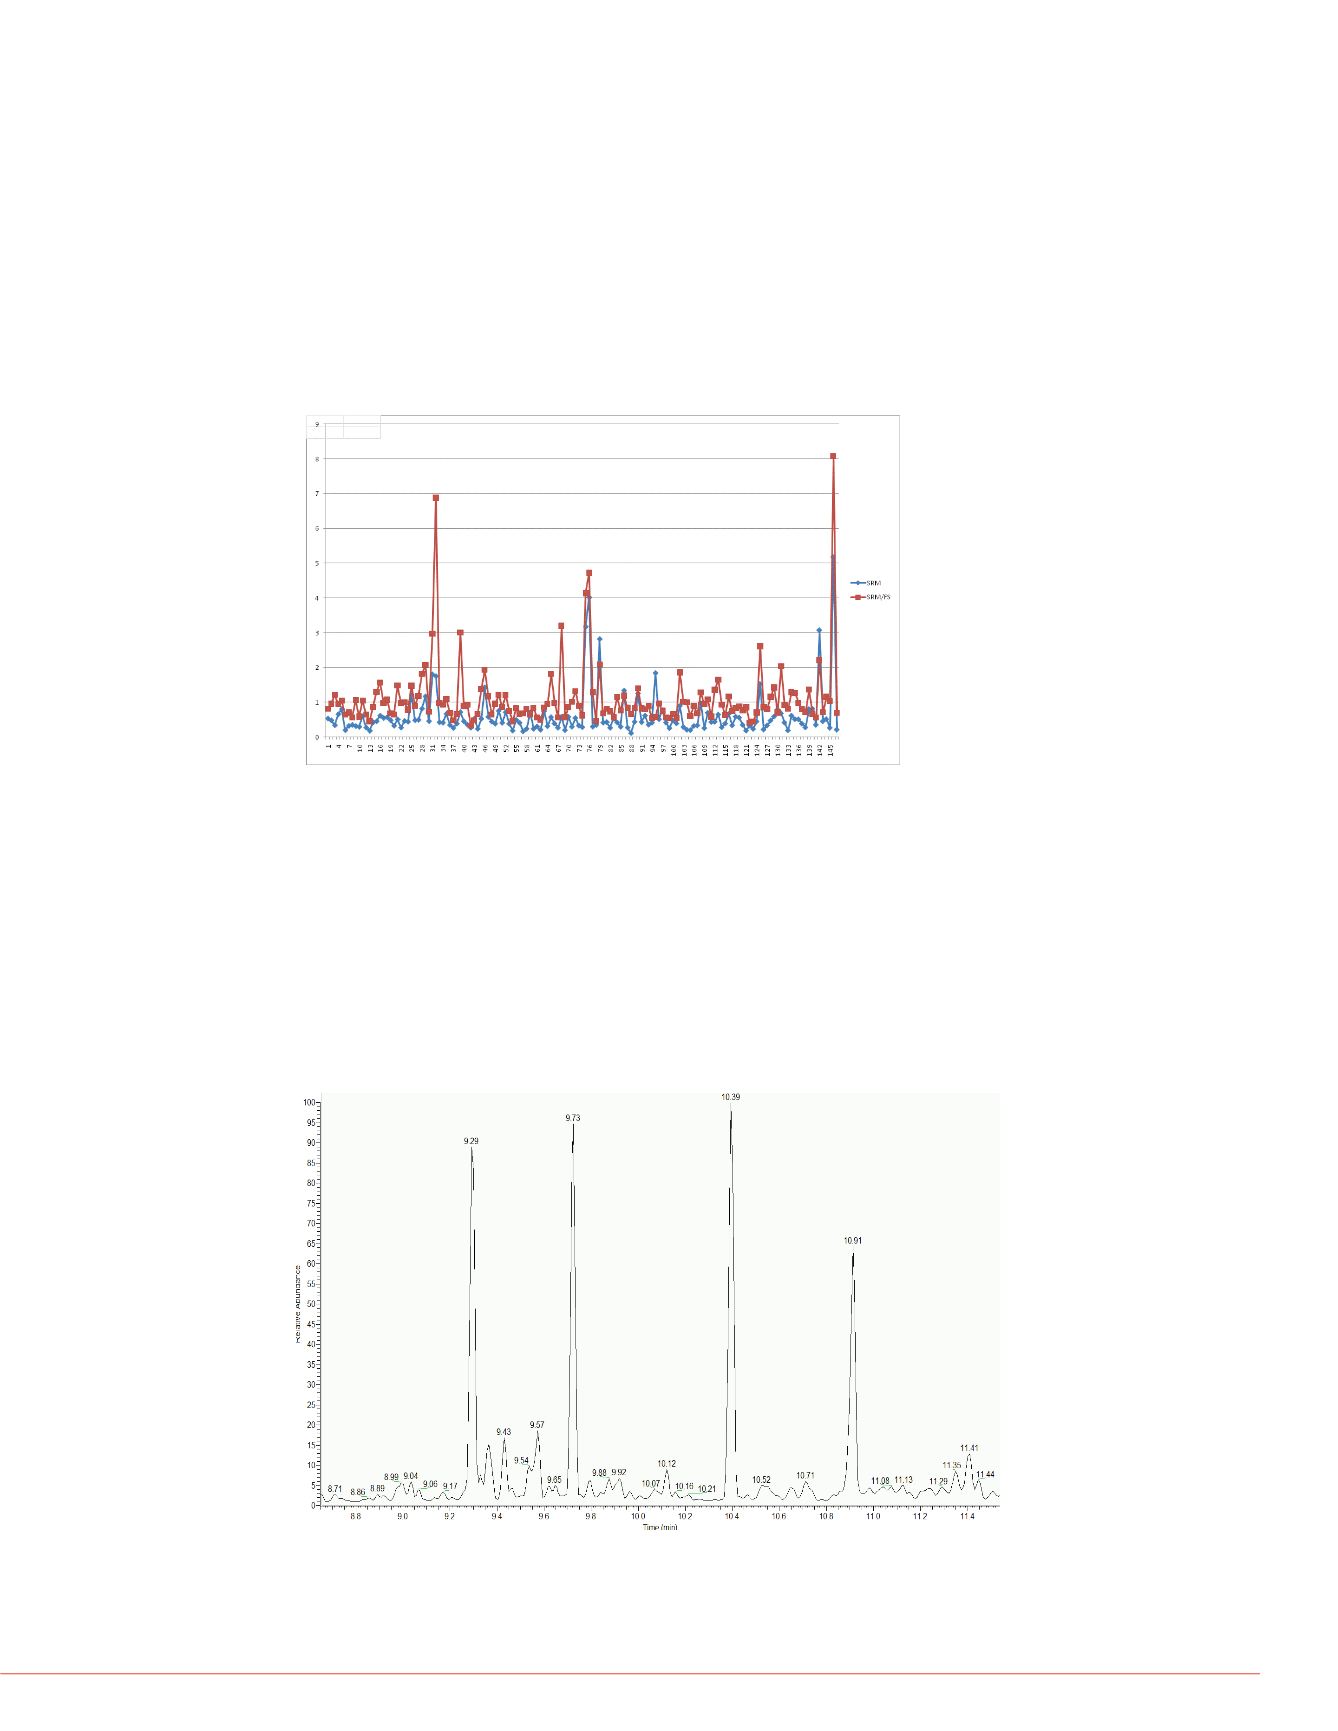
methods are shown in Figure 4. MDLs are slightly higher with the full scan added to
the instrument method, but very comparable.
FIGURE 4. Comparison of MDLs from SRM vs. SRM/FS analysis (ppb).
Fruit drink was spiked at 100 ppb and analyzed using the SRM/FS instrument mode.
This extract was also spiked with two phthalates at a 1 ppm level. The full scan
chromatogram shows several peaks above the 100 ppb pesticide spike. Peaks are at
retention times of 9.29, 9.73, 10.39, 10.91, and a very large saturated peak at 31.00
minutes. A close-up view of the first four compounds is shown in Figure 5. Figure 6
displays the NIST library matches for those non-targeted compounds.
Dimethyl phthalate at 9.29 m
Diethyl phthalate at10.39 min
tophos
lobutanil


