5
Thermo Scientific Poster Note
•
BioPharma_PN63712
_E 11/13S
intactHumira_ETD15_LP_HCD_240k
#
11-27
RT:
6.11-11.23
AV:
17
NL:
1.07E4
T:
FTMS+ pESIFullms22800.00@etd15.00 [200.00-4000.00]
500
1000
1500
2000
2500
3000
3500
m/z
0
10
20
30
40
50
60
70
80
90
100
RelativeAbundance
1702.5
1703.0
1703.5
1704.0
1704.5
1705.0
1705.5
1706.0
1706.5
1707.0
m/z
0
10
20
30
40
50
60
70
80
90
100
RelativeAbundance
R=111081
R=105350
R=109093
R=104772
R=108541
R=110104
R=94282
R=102177
R=108646
R=108759
R=109703
R=101019
R=107362
R=97925
R=105375
R=112194
R=103665
R=99113
R=82023
R=86808
y
91
7+
z = 6
c
125
8+
/c
·
125
8+
Conclusion
•
The analysis of intact and redu
mass spectrometer provides the a
valuable information about the pre
•
Analysis of the reduced antibody
spectra for both light and heavy ch
•
The combination of multiple fra
analysis (SID, CID, HCD and
sequence coverage and enables
minimum sample preparation.
•
For measurements of intact light
detection of fragment ion spectr
high resolution as provided by th
essential.
Abbreviations
ACN, acetonitrile; CID, collision-in
linear trap; DTT, dithiothreitol; ETD
formic acid; HCD, higher energy
monoclonal antibody; µS, micro-sca
ion monitoring.
References
1.
Bondarenko, P.V., Second, T.
Zhang, Z. Mass measurement
intact monoclonal antibodies o
Orbitrap mass spectrometer.
J
Mass Spectrometry
20
, 1415-2
2.
Michalski, A.
et al.
Ultra high re
spectrometer (Orbitrap Elite) f
versatile peptide fragmentati
proteomics: MCP
(2011).doi:10.
Acknowledgemen
We would like to thank Paul Thomas
for processing the HUMIRA ETD dat
HUMIRA is a trademark of AbbVie. All other tradem
its subsidiaries.
This information is not intended to encourage use of
the intellectual property rights of others.
For Research Use only, not for Use in Diagnostic Pr
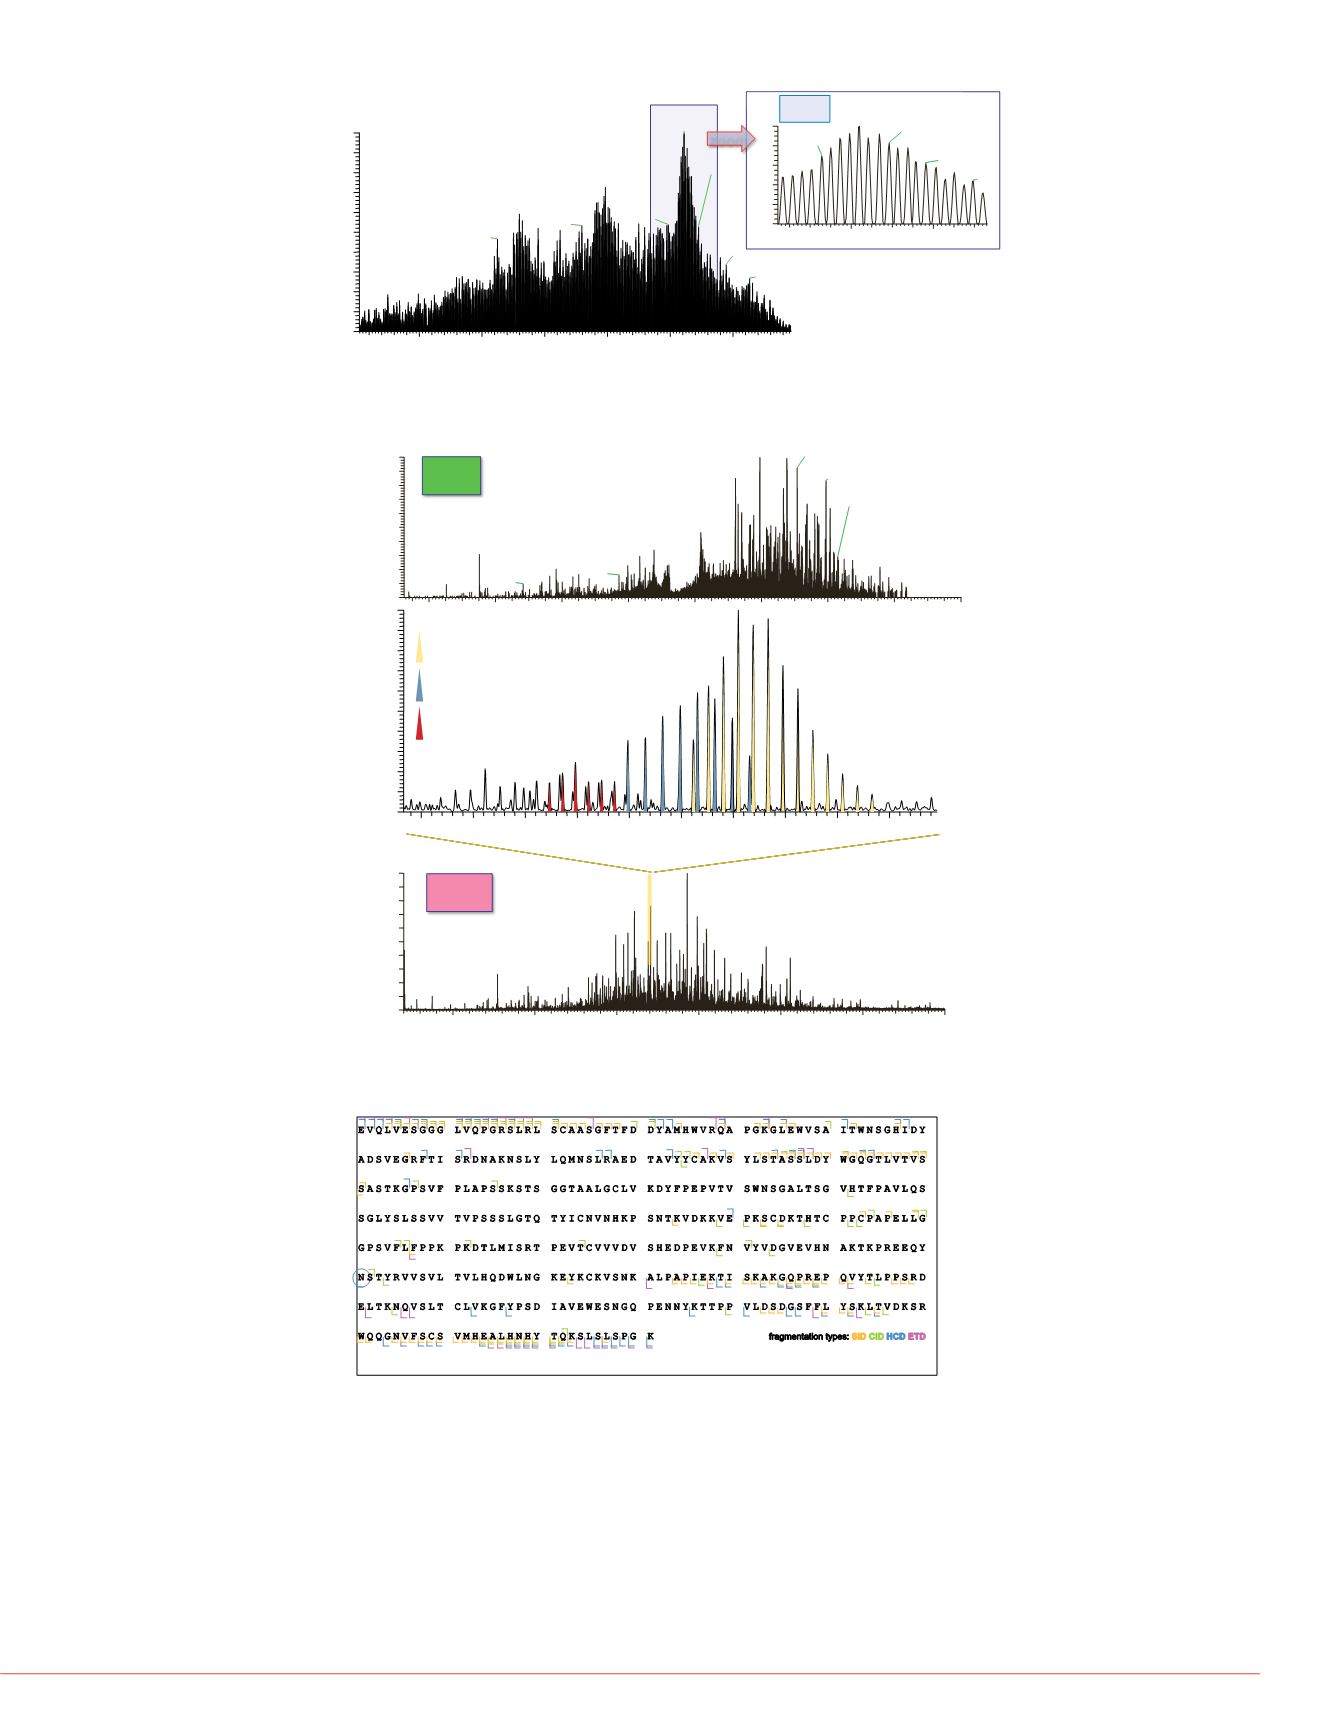
FIGURE 8:
Summarized sequence coverage of the HUMIRA heavy chain
using fragmentation techniques SID, CID, HCD, and ETD. Optimized
conditions: trapping under high pressure settings. N: Putative
glycosylation site.
FIGURE 7:
(A) CID spectrum and (C) ETD spectrum of
intact
HUMIRA
antibody. (B) Zoom in into the ETD fragment ion spectrum of
intact
HUMIRA
showing the need for highest resolution possible.
(A)
(C)
(B)
CID
ETD
23420
23430
23421.61756
23433.66736
23435.63611
23419.59961
23428.60343
tact light chain of HUMIRA. (B)
ht chain. (C) Simulation of isotope
e pattern of intact light chain after
(M) of the measured light chain of
ith Xtract.
measured
simulated
13
z=11
z=10
z=12
Isotope pattern after
deconvolution with Xtract
Monoisotopic mass (M) of the
intact light chain
after
deconvolution with Xtract
Humira_CID_59_120210173005
#
1
RT:
355.98
AV:
1
NL:
6.11E3
T:
FTMS+ pESIFullms21185.00@cid50.00 [325.00-4000.00]
400
600
800
1000
1200
400
1600
1800
2000
m/z
0
10
20
30
40
50
60
70
80
90
100
RelativeAbundance
1395.24207
z=18
1507.50037
z=8
1321.86304
z=?
1594.27380
z=8
1217.55786
z=?
1076.95667
z=24
551.31708
z=1
1629.42053
z=8
1756.70886
z=7
782.33112
z=?
971.26849
z=?
683.26221
z=2
452.24893
z=1
FIGURE 6:
HUMIRA heavy chain acquired in SIM scan mode (z=43). 60 µscans were
averaged. Deconvoluted mass: Mr 50,891.04317 Da. The inserts on the right
demonstrate isotopic resolution of that charge state detected at m/z 1185 and masses
obtained after deconvolution using Xtract.
HUMIRA_heavy_av_SIM
#
1
RT:
1556.88
AV:
1
NL:
3.30E3
T:
FTMS+ pESISIMms [1180.00-1190.00]
1181
1182
1183
1184
1185
1186
m/z
0
10
20
30
40
50
60
70
80
90
100
RelativeAbundance
1185.2190
R=117700
1183.9644
R=120204
1182.5933
R=116404
1184.9670
R=121104
1183.5918
R=122204
1185.4508
R=122004
1182.2444
R=121404
1185.8925
R=109804
1181.6860
R=117204
1186.2635
R=127904
1180.9857
R=133304
Deconvolution
50890
50900
50910
50920
m/z
0
20
40
60
80
100
0
20
40
60
80
100
RelativeAbundance
50891.04317
50922.0749
Humira_heavy_av_SIM
#
1
RT:
1556.88
AV:
1
NL:
3.30E3
T:
FTMS+ pESISIMms [1180.00-1190.00]
1185.2
1185.4
m/z
0
20
40
60
80
100
RelativeAbundance
1185.2190
R=117700 1185.2921
R=117704
1185.1287
R=120804
1185.3820
R=118304
1185.4961
R=120004
z=43
1301.5
1302.0
1302.5
.43152
1301.59814
1301.70923
.43034
1301.59741
1301.70878
1301.82014
1301.98718
NL:
3.84E5
FS_tripleSIM_20uS_1#19 RT:
7.66 AV: 1 T: FTMS + p ESI
SIM ms [1290.00-1320.00]
NL:
2.13E3
c
1027
h
1606
n
282
o
332
s
6
+H:
C
1027
H
1624
N
282
O
332
S
6
p (gss, s /p:40) Chrg 18
R: 120000 Res .Pwr . @FWHM
Δ
=0.9ppm
24.100
0
2000
2200
2400
2600
2800
1956.39819
2134.19409
4465
2347.60156
2610.80981
zoom


