5
Thermo Scientific Poster Note
•
PN ASMS13_WP24_ZHao_e 06/13S
ylated (A) and deglycosylated (B)
of the intact antibody major
er than expected. There are also two
d to be confirmed.
lycans from bovine fetuin by a
h MS detection.
for high performance LC/MS
roteins (data not shown). Analyzing
eaction step and cumbersome
s the original glycan profile without
reaction.
using GlycanPac AXH-1 column and
ody identified glycoforms derived from
s, G0F, G1F and G2F. However, the
this antibody ranged from 20-60 ppm
erved for other samples (data not
e deglycosylated form of this antibody
ome minor glycosylation forms of this
l had interfered with the observed
haracterize this antibody, released
he GlycanPac AXH-1column. The
c AXH-1 column are based on charge
acidic sialylated species. Glycans of
n their size and polarity (
Figure 5
).
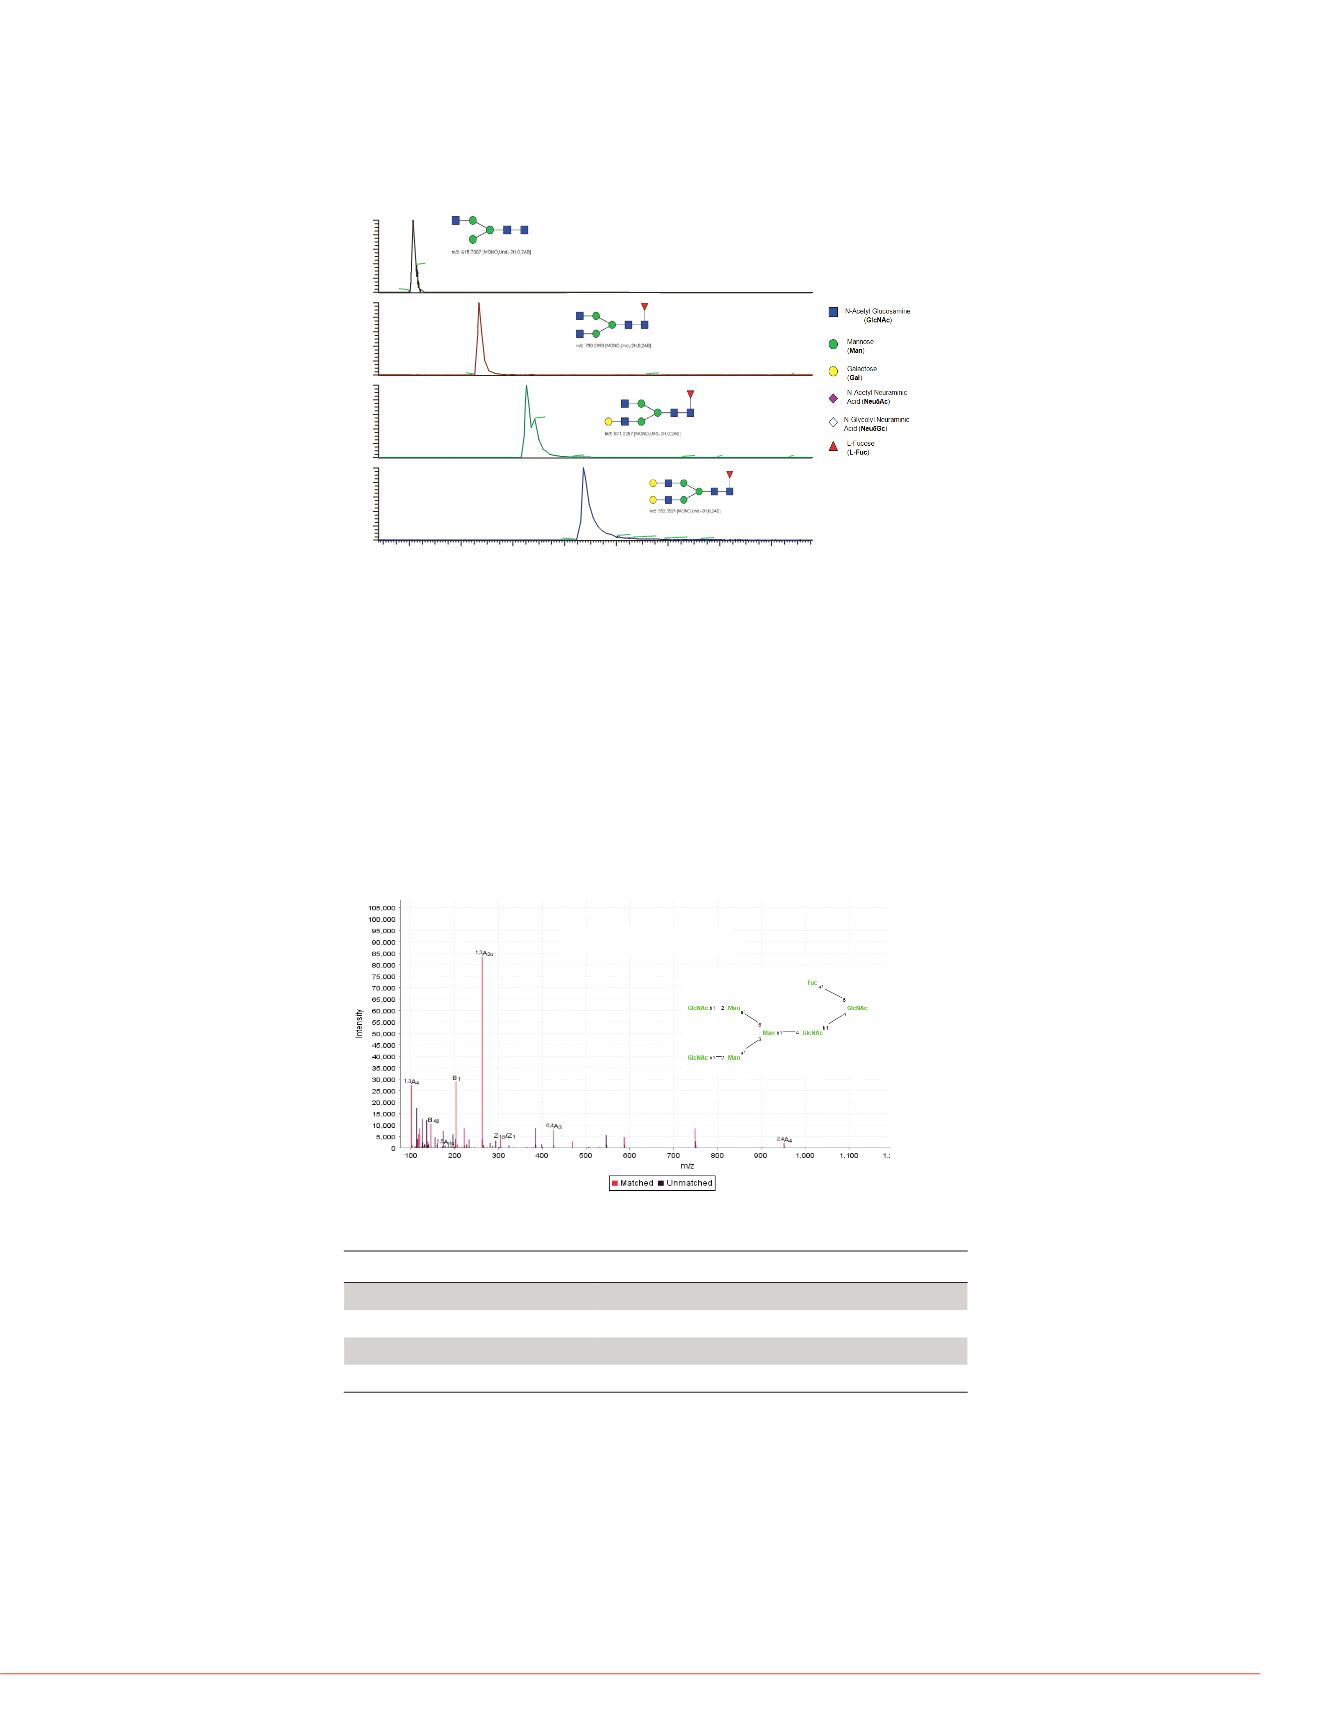
Characterization of glycans in each peak was performed by Full MS and data
dependent MS/MS using HCD. The information-rich HCD spectra contain fragment ions
that were generated from both cross-ring and glycosidic bond fragmentations (Figure 6).
Three different types of glycans were found from this monoclonal antibody, the majority
of glycans identified were neutral, including G0F, G1F and G2F which were also the
major glycoforms identified at the intact protein level for this antibody (Figure 4A). Also
identified were less abundant, non-fucosylated forms of G1 and G2, minor amounts of
mono-sialylated and di-sialylated species with and without fucosylation, as well as
double fucosylated species that were not identified at the intact protein level (Figure 7).
RT:
4.80 -21.86
6
8
10
12
14
16
18
20
Time (min)
0
20
40
60
80
100
0
20
40
60
80
100
0
20
40
60
80
100
RelativeAbundance
0
20
40
60
80
100
6.15
6.28
6.01
8.69
10.70
8.51
14.58
12.31
16.65
13.28
15.15
17.92
19.81 20.79
10.52
10.84
12.33
14.51 15.98 16.54 17.91
19.79 20.68
5.61
12.73
14.05 14.65 15.84 17.26 18.76
21.10
20.01
12.39
G0F
G1F
G2F
Figure 5. Separation of the major, neutral N-glycans on GlycanPac AXH-1
column
Figure 7. Identified glycans from monoc
Conclusion
GlycanPac AXH-1 column separates glyca
charge, size and polarity.
The GlycanPac AXH-1 columns are comp
or FT-MS/MS analysis of both native and l
antibodies were carried out successfully u
Confident identification and structural confi
using high-resolution HCD MS/MS which p
containing glycosidic and cross ring fragm
A complete workflow solution was develop
unique GlycanPac AXH-1 column technolo
This workflow was applied to characterize
Confident identification and structural confi
glycans from the monoclonal antibody.
References
1. Bigge, J. C. et al., Non-selective and effi
2-amino benzamide and anthranilic acid.
238.
2.
Apte, A and Meitei, N.S., Bioinformatics i
mass spectrometric data using SimGlyca
Figure 6. Identification and structural confirmation of released glycan using high
resolution HCD MS/MS
Fragment ion type
Percentage match (%) of theoretical fragments
Single glycosidic
32.14
Glycosidic/glycosidic
30.95
Single cross ring
20.21
Cross ring/glycosidic
14.95
SimGlycan is a registered trademark of PREMIER Biosoft I
Thermo Fisher Scientific and its subsidiaries.
This information is not intended to encourage use of these p
intellectual property rights of others.
G
pr
Glycans identified
only in released form
G0F/G0F
-3.4ppm
-6.8ppm
G0F/G1F
G1F/G1F (orG0F/G2F)
-8.4ppm
G1F
-25.
Figure 8 Annotated glycoforms of a mo
2200 2300 2400 2500 2600 2700 2800 2900 3000 3100 3200 3300 3400 3500
m/z
0
5
10
15
20
25
30
35
40
45
50
55
60
65
70
75
80
85
90
95
00
5
2671.11
2828.15
2575.73
2530.57
2884.72
2943.60
2486.98
3004.84
2444.78
3068.71
3135.42
2404.34
2326.63
2289.67
3205.20
3278.053354.23
2254.13
3434.14 3497.41
-7.0ppm
Mass error as expected
deconvolution
-0.7ppm
These results explain that the unexpected ma
interfering minor glycoforms that have a mole
deconvoluted MS spectrum, the base of the a
mass range of about 40 Da due to the distribu
large protein of this size. Therefore any interf
difference would cause a mass shift of the ma
separate peak. For example, in this case, the
Neu5Ac, which would have a mass difference
shift observed in this study, especially when t
abundance (Figure 8). Results in this study i
glycan profiling can be achieved using Glycan
LC-MS/MS.
Full MS spectrum of deglycosylated mAb
Extracted ion chromatogram of the neutral glycans
HCD spectrum of G2F
se
(L-Fuc)


