4
A Complete Workflow Solution for Monoclonal Antibody Glycoform Characterization Combininga Novel Glycan Column Technology and
Bench-Top Orbitrap LC-MS/MS
Figure 4. Observed molecular mass of glycosylated (A) and deglycosylated (B)
forms of a intact monoclonal antibody. Some of the intact antibody major
glycoforms have an observed mass error larger than expected. There are also two
potentially double fucosylated peaks that need to be confirmed.
orkflow solution for monoclonal antibody
arge, Size and Polarity
used for qualitative, quantitative, structural
rged (neutral) and charged glycans present in
f glycans are based on charge; the neutral
aration of acidic glycans from mono-sialylated,
ted and finally penta-sialylated species. Glycans
ated based on their size and polarity. In this
in each peak was determined using high
ure 2, the detailed structural information
ed the ability of GlycanPac AXH-1 column to
charge, size and polarity. However, co-elution of
on with other commercially available HILIC
beled N-glycans from bovine fetuin by
with MS detection.
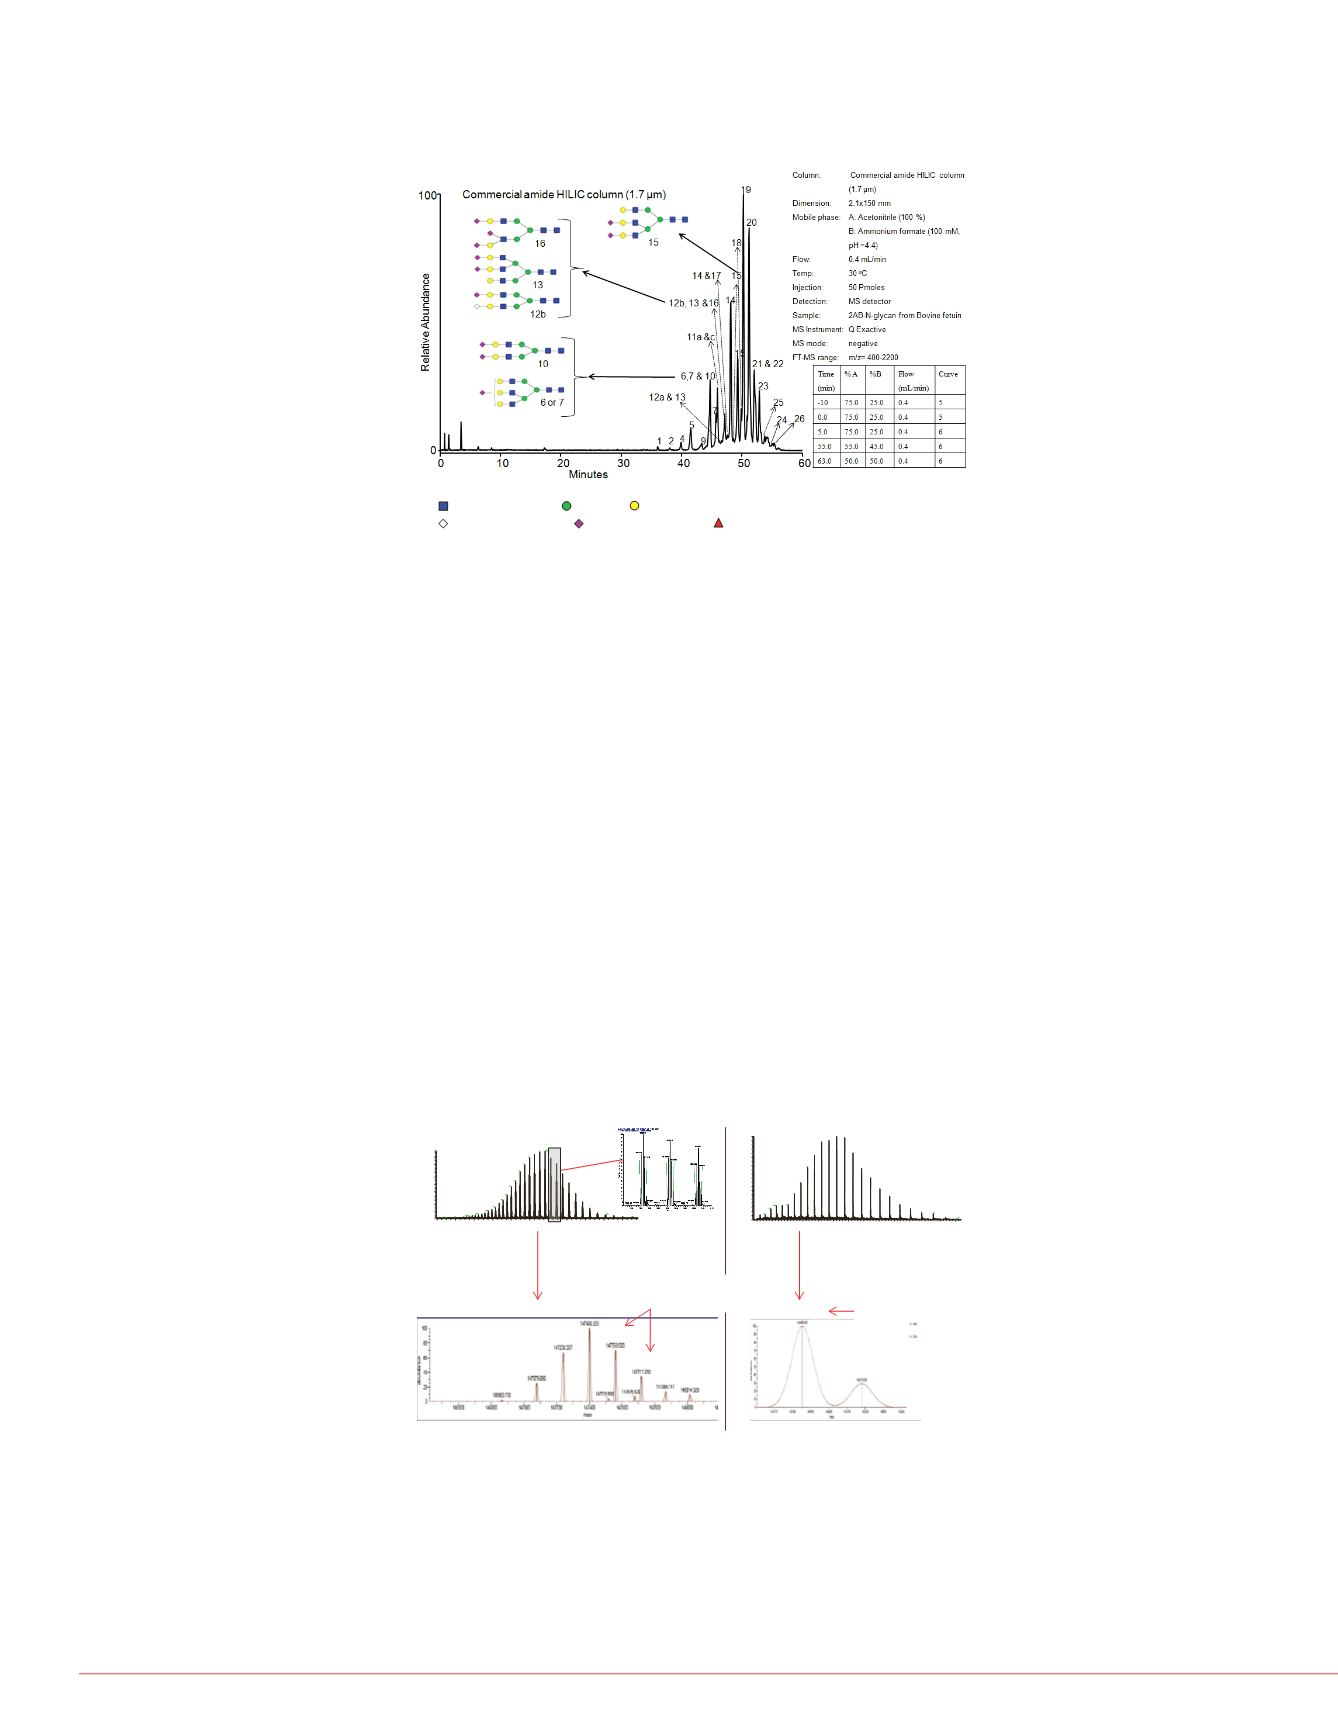
Figure 3. LC-MS analysis of 2-AB labeled N-glycans from bovine fetuin by a
commercial amide HILIC column (1.7 µm) with MS detection.
The GlycanPac AXH-1 column is also well suited for high performance LC/MS
separation and analysis of native glycans from proteins (data not shown). Analyzing
unlabeled glycans not only eliminates the extra reaction step and cumbersome
cleanup methods during labeling, but also retains the original glycan profile without
adding further ambiguity imposed by the labeling reaction.
Monoclonal antibody (mAb) glycan profiling using GlycanPac AXH-1 column and
high resolution LC-MS/MS
Intact mass measurement of a monoclonal antibody identified glycoforms derived from
the combination of any two of the three N-glycans, G0F, G1F and G2F. However, the
mass errors for some of the intact glycoforms of this antibody ranged from 20-60 ppm
(Figure 4A) which is larger than the <10 ppm observed for other samples (data not
shown). Furthermore, the intact mass error for the deglycosylated form of this antibody
was within 10 ppm (Figure 4B), suggesting that some minor glycosylation forms of this
molecule that were not detected at the intact level had interfered with the observed
intact mass of the major glycoforms. To further characterize this antibody, released
glycans from this protein were separated using the GlycanPac AXH-1column. The
separation and elution of glycans from GlycanPac AXH-1 column are based on charge
with neutral glycans eluting first, followed by the acidic sialylated species. Glycans of
each charge state are further separated based on their size and polarity (
Figure 5
).
Characterization of glycans in each
dependent MS/MS using HCD. The
that were generated from both cros
Three different types of glycans we
of glycans identified were neutral, i
major glycoforms identified at the i
identified were less abundant, non-
mono-sialylated and di-sialylated s
double fucosylated species that we
RT:
4.80 -21.86
6
8
10
12
Ti
0
20
40
60
80
100
0
20
40
60
80
100
0
20
40
60
80
100
RelativeAbundance
0
20
40
60
80
100
6.15
6.28
6.01
8.69
10.70
8.51
12.31
10.52
10.84
12.3
5.61
12.7
12.39
G0F
G1
Figure 5. Separation of the major
column
Figure 6. Identification and struc
resolution HCD MS/MS
Fragment ion type
Single glycosidic
Glycosidic/glycosidic
Single cross ring
Cross ring/glycosidic
G0F/G0F
-3.4ppm
-6.8ppm
G0F/G1F
G1F/G1F (orG0F/G2F)
-8.4ppm
G1F/G2F
-25.4ppm
G2F/G2F
-57.3ppm
? ?
Mass error larger
than expected
1800
2000
2200
2400
2600
2800
3000
3200
3400
3600
3800
m/z
0
10
20
30
40
50
60
70
80
90
100
Relative Abundance
2907.25
2797.59
3025.87
3088.89
2745.82
2695.90
2968.59
3154.57
2647.78
3223.15
2601.35
3294.72
2556.54
2513.21
3369.59
2430.84
3447.92
2353.71
3529.93
2246.72
3616.00
2149.04
3801.463901.52
2003.93
1899.12
G0F+G1F
G1F+G2F
G0F+G0F
G0+G0F
G0F+G2F
2200 2300 2400 2500 2600 2700 2800 2900 3000 3100 3200 3300 3400 3500
m/z
0
5
10
15
20
25
30
35
40
45
50
55
60
65
70
75
80
85
90
95
100
RelativeAbundance
5
2671.11
2828.15
2575.73
2530.57
2884.72
2943.60
2486.98
3004.84
2444.78
3068.71
3135.42
2404.34
2326.63
2289.67
3205.20
3278.053354.23
2254.13
3434.14 3497.41
-7.0ppm
Mass error as expected
A
B
deconvolution
deconvolution
-0.7ppm
A
Full MS spectrum of mAb
Full MS spectrum of deglycosylated mAb
Extracted ion chrom
H
R Biosoft was used for glycan identification and
ftware accepts raw data files from Thermo
lucidates the associated glycan structure by
niques.
ed using Thermo Scientific™ Protein
spectra for deconvolution were produced by
bundant portion of the elution profile for the mAb.
charge states from the input
m/z
spectrum were
k. To identify glycoforms, the masses were
f various combinations of commonly found
al)
eu5Gc)
,
L-Fucose
(L-Fuc)
N-Acetyl-Glucosamine
(GlcNAc),
Mannose
(Man)
,
Galactose
(Gal)
N-AcetylNeuraminicAcid
(Neu5Ac)
,
N-Glycolyl-NueraminicAcid
(Neu5Gc)
,
L-Fucose
(L-Fuc)
lycans
Labeled glycans
2AB/2AA labeling
2AB
GlycanPac AXH-1 solumn
Ultimate 3000
UHPLC
ve MS
Separation
of glycans


