6
Targeted Quanti cation of O-Linked Glycosylation Site for Glycan Distribution Analysis
Conclusion
The targeted protein workflow presented facilitated detection, verification, and
quantification of Apo CIII across biological samples. Targeting at the protein level
provides significant advantages of evaluating unmodified peptides to provide
landmarks for modified peptide confirmation.
Incorporation of MSIA enrichment increased sensitivity ca. 1000-fold compared to
whole serum digest analysis
Unbiased HR/AM MS and data-dependent/dynamic-exclusion acquisition
facilitates post-acquisition data processing workflow
The Pinpoint screening tool generates a list of highly confident set of modified and
unmodified targeted peptides from 100,000s of sequences
Pinpoint data processing incorporates multiple scoring levels, significantly
increasing confidence in the final relative quantification results
References
1. Maeda, H.; Hashimoto, R. K.; Ogura, T.; Hiraga, S.; Uzawa, H.
J. Lipid Res.
1987,
28(12),
1405–1409.
2. Zhao, P.; Viner, R.; Teo, C. F.; Boons, G.; Horn, D.; Wells, L.
J. Proteome Res.
2011,
10(9),
4088–4104.
3. Nedelkov, D.; Kiernan, U. A.; Niederkofler, E. E.; Tubbs, K. A.; Nelson, R. W.
PNAS
2005,
102(31),
10852–10857.
Acknowledgements
We would like to thank Dr. MingMing Ning from Massachusetts General Hospital for
providing the samples used in the experiment.
luated to provide additional
ce. Figure 6 shows an example of
tinguish each base peptide and
ectra in the Thermo Scientific™
rge state and accurate
m/z
value
uct ion assignment based on the
ition identified from the screening tool.
tide sequence was
m/z
2137 for the
–79 peptides assigned as the base
r each fragment ion was less than 5
ributed to the missed cleavage site,
irm the sequence, specifically the b-
or each glycoform. The results for the
7. The unmodified forms of the
showed a lower relative response
n facilitates peptide sequence
ose
O
-linked glycopeptides modified
forms modified at multiple sites,
ctron transfer dissociation (ETD)
ted here can automatically create a
D data acquisition.
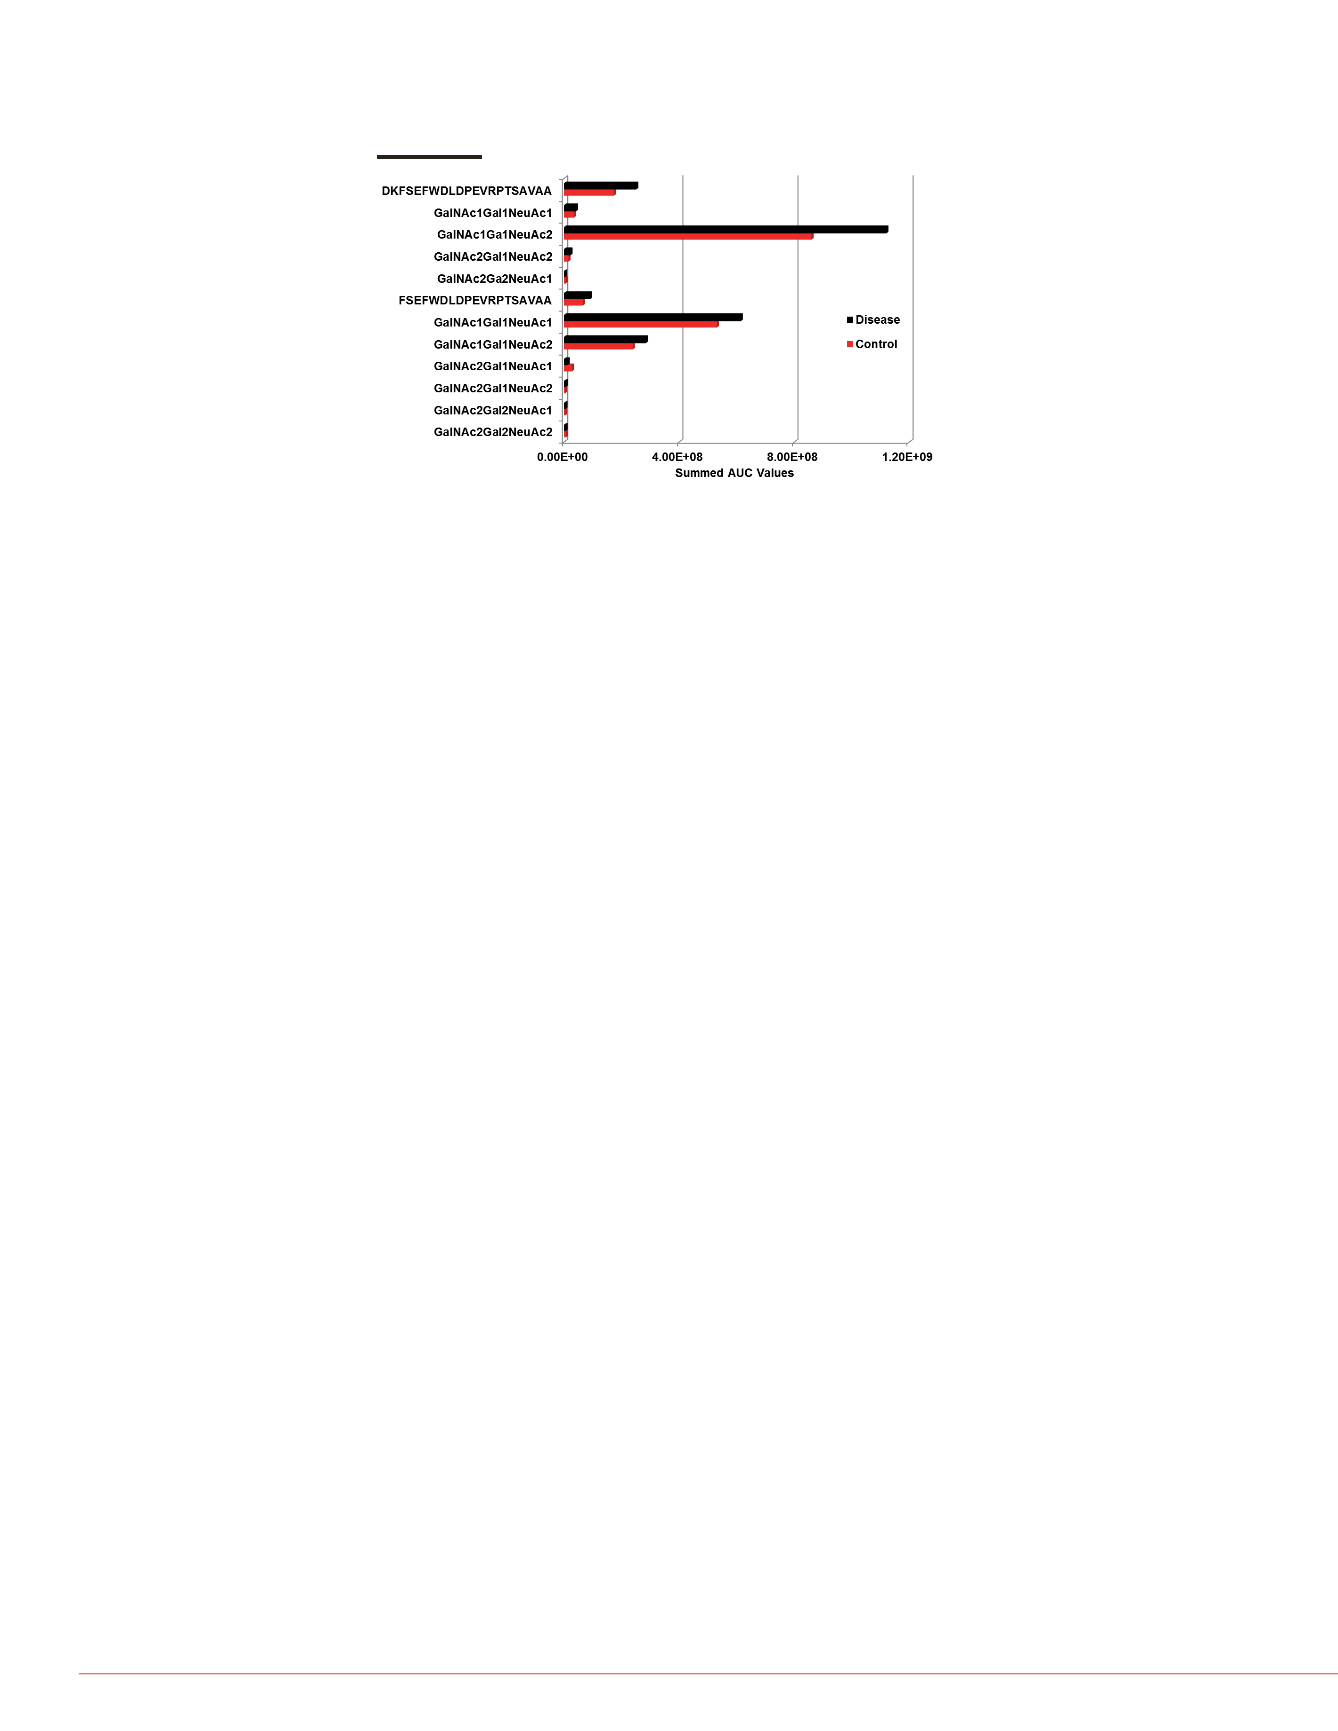
FIGURE 7. Comparative distribution of unmodified and
O
-linked glycopeptides
from Apo CIII. Integrated peak areas from HR/AM MS data were used for the
comparison of glycoform distribution as well as the relative amounts across
each sample.
00
2000
2200
2400
2137.0342 z=1
1977.9579 z=1
2047.9893 z=1
1877.8766 z=1
2381.1536 z=1
1990.9480 z=1
1829.8912 z=1
2221.0483 z=1
2137.0229 z=1
2292.1145 z=1
1902.9080 z=1
L: 4.54E5
NL: 1.49E6
y18
y19
b19
b20
y17
y15 + GalNAc
Base Peptide
b16
b17
b18
Base Peptide
LDPEVRPTSAVAA [GalNAcGalNeuAc]
+3
DLDPEVRPTSAVAA [GalNAcGalNeuAc]
+3
uct correlation coefficients as
e identified glycoforms for
DPEVRPTSAVAA.
or the
O
-linked glycopeptides
DPEVRPTSAVAA with the same
a were acquired under the
All trademarks are the property of Thermo Fisher Scientific and its subsidiaries.
This information is not intended to encourage use of these products in any manners that might infringe the
intellectual property rights of others.


