6
Novel Glycan Column Technology for the LC-MS Analysis of Labeled and Native
N
-Glycans Released from Proteins and Antibodies
Conclusion
The GlycanPac AXH-1 column separates glycans with unique selectivity based on
charge, size, and polarity not possible with commercial HILIC columns.
LC-ESI-FTMS or FT-MS/MS analysis of both native and labeled glycans from proteins
and antibodies were carried out successfully using GlycanPac AXH-1 columns.
The GlycanPac AXH-1 column is useful for both high-resolution charge-based
separation and easy quantification of glycans.
The GlycanPac AXH-1 columns are compatible with various MS instruments.
These new columns have high-chromatographic efficiency and excellent column
stability.
The GlycanPac AXH-1 column is also useful for the separation of reduced
O
-glycans
from proteins and mucins.
The GlycanPac AXH-1 column is useful for the analysis of charged and neutral
glycosylaminoglycans and glycolipids.
References
1. Varki, A. Biological Roles of Oligosaccharides: All the Theories Are Correct.
Glycobiology
1993
,
3
, 97
–
130.
2. Bertozzi, C.R.; Freeze, H.H.; Varki, A.; Esko, J.D.
Glycans in Biotechnology and the
Pharmaceutical Industry
,
Essentials of Glycobiology, Second Edition;
Cold Spring
Harbor Laboratory Press: New York, 2009; Chapter 51.
3. Guidance for Industry, Scientific Considerations in Demonstrating Biosimilarity to a
Reference Product, Draft Guidance;
U.S. Department of Health and Human Services
Food and Drug Administration, February 2012 [Online]
/
GuidanceComplianceRegulatoryInformation/Guidances/UCM291128.pdf (accessed
Jan. 18, 2013).
4. Bigge, J.C. et al., Non-Selective and Efficient Fluroscent Labeling of Glycans Using
2-Amino Benzamide and Anthranilic Acid.
Anal. Biochem.
1995
,
230
, 229
–
238.
5. Apte, A; Meitei, N.S. Bioinformatics in Glycomics: Glycan Characterization with Mass
Spectrometric Data Using SimGlycan.
Methods Mol. Biol.
2010
,
600
, 269
–
81.
Acknowledgements
We would like to thank Mark Tracy, Yoginder Singh, Jessica Wang, and Patrick K. Bennett
from Thermo Fisher Scientific for their help and permission to use their UHPLC and MS
instruments.
from Bovine fetuin. All the peaks are
e.
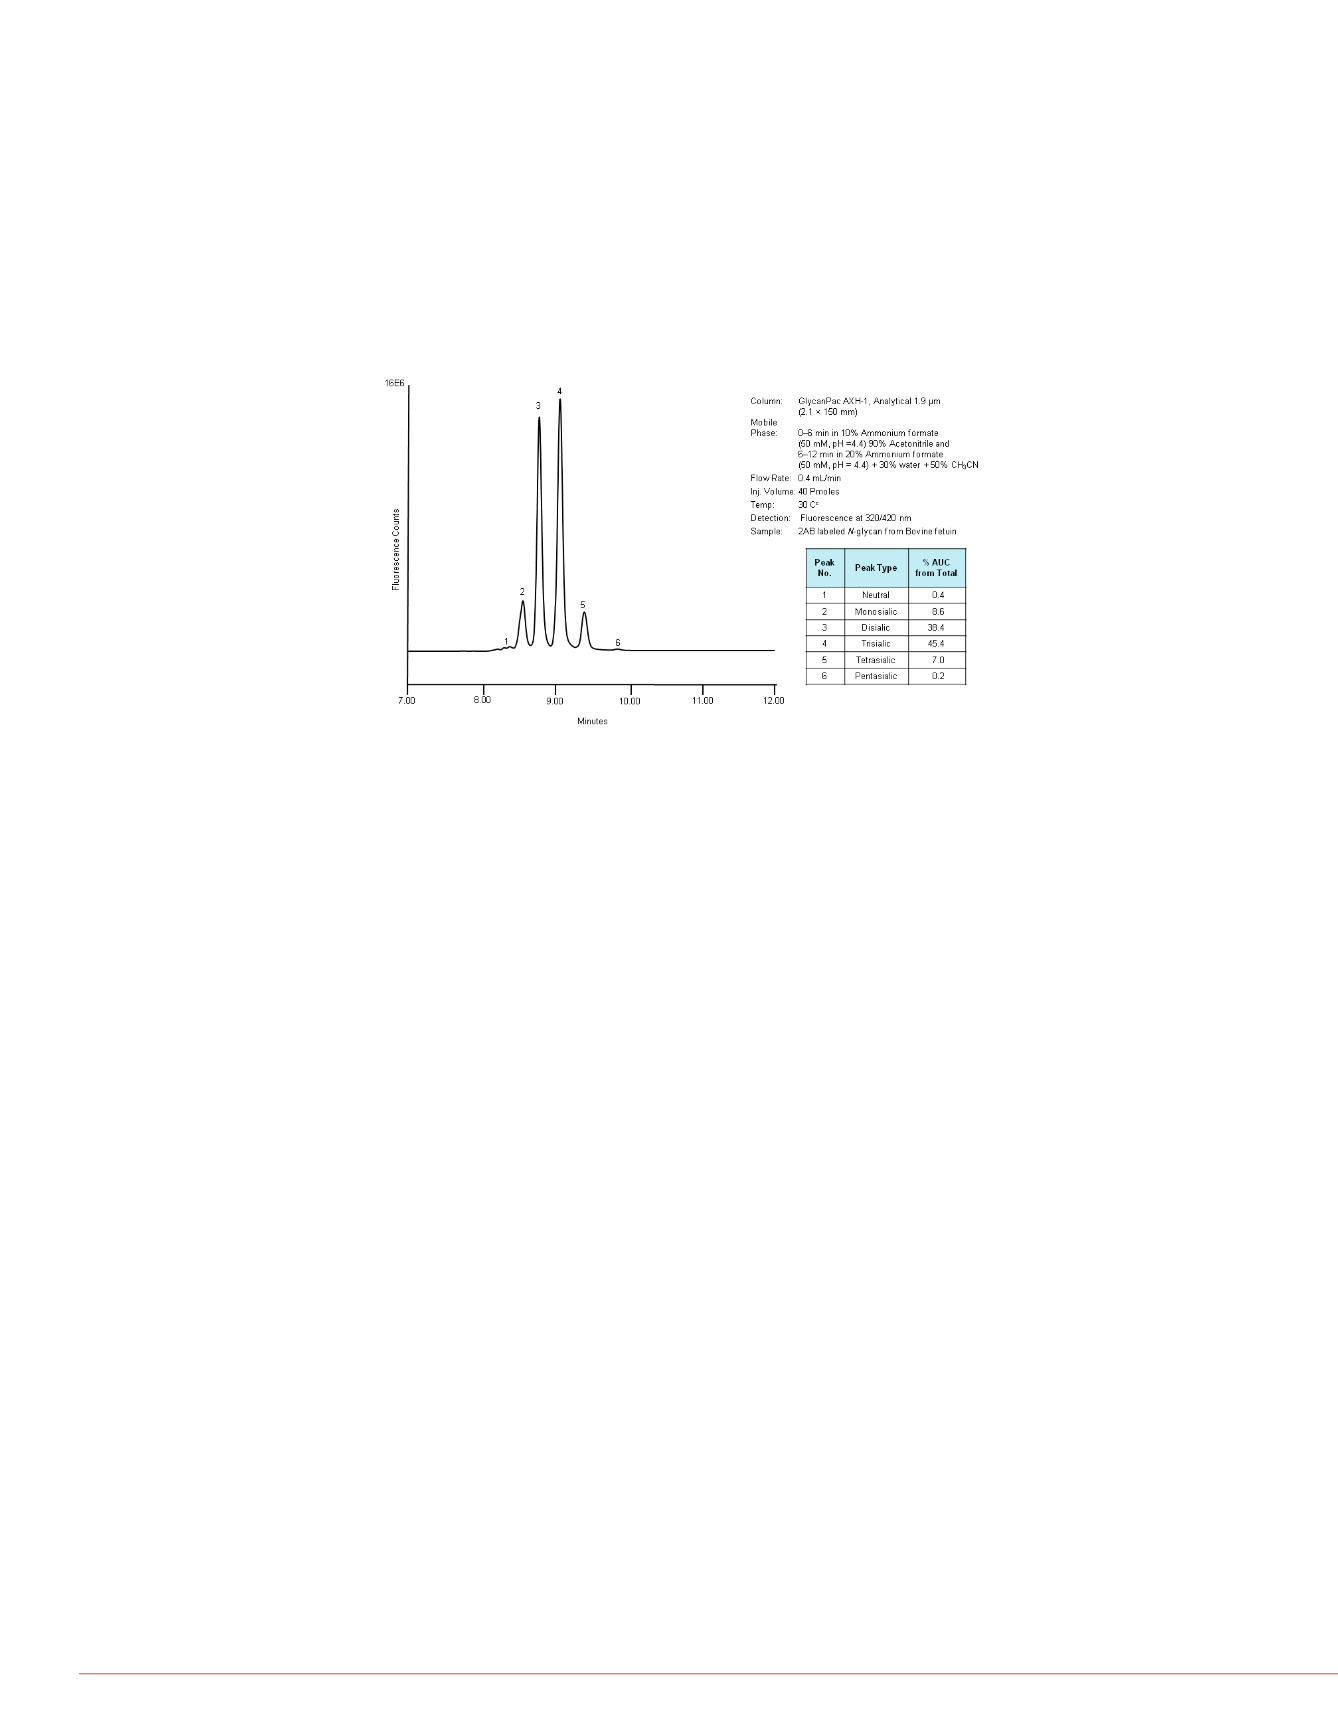
Quantitative Determination of Glycans Based on Charge
Quantitative analysis of each glycan is essential for quick assessment of glycan variation
in protein batch comparisons and for comparison of diseased to normal cell glycosylation
profiles. In addition, quantitative analysis of glycans separated based on charge state also
provide a tool for calculating the relative amounts of different sialic acid linkages after
enzymatic digestion with silidase S and sialidase A. Figure 8 shows the quantitative
analysis of 2AB labeled
N
-glycans based on charge the using GlycanPac AXH-1 column
(1.9 µm) with fluorescence detection. The relative amount of each charge state glycan
was estimated using a standard curve. A standards curve was drawn using the data from
the chromatographic analysis of 2AB labeled A2 glycan standard, with the injection of
different amount of samples starting from 0.1 to 5 pmole).
FIGURE 8: Quantitative estimation of each charge state glycan in 2AB labeled
N
-glycan from Fetuin
odies by LC-MS Using
s a part of the development of
s is a prime source of product
nction. Variation in glycosylation is
variation,
2-3
affecting product stability
ctions
in vivo.
A representative
ibody glycans is shown in Figure 6,
rated using the GlycanPac AXH-1
ch peak was performed by
ee different glycan charge states
ans are neutral or monosialylated,
ation of glycans based on charge
ially available HILIC columns.
from human IgG.
n of glycans in each Figure 6 peak.


