3
Thermo Scienti c Poster Note
•
PN ASMS13_Th385_SPeterman_E 07/13S
ation and quantification of
per targeted protein.
unbiased HR/AM LC-MS and
ching strategy based on
accurate mass values creating
alysis across samples.
resulted in ca. 1,000-fold
es per Apo CIII peptide
whole serum digest. The
rization, and quantification of
led direct comparison to the
ous glycoforms, and
challenging due to the
ion signal, and lack of common
put for identification and
ding glycoforms is to perform
s. Multi-level scoring attributes
in a refined list of highly
uisition of high-resolution,
tandem-MS dramatically
s a score and integrated peak
ified peptides attributed to the
d from normal and stroke
ots. One set of samples were
without further preparation. The
unoassay (MSIA) direct analysis
ti-Apo CIII antibody. Following
ed, alkylated, and digested
with the ratio of analyte:enzyme
he PRTC kit was spiked as an
c™ Hypersil GOLD™
binary solvent system
aid in MeCN. A linear gradient of
n washing and re-equilibration.
™ Q Exactive™ mass
lusion mode using a Top10
d using a resolution setting of
ing 15K. All data was acquired
hermo Scientific™ Proteome
orresponding peptides. The
le modifications of
o CIII protein sequence and
rred to prototype version of
for
O
-linked glycopeptides. The
ormation with individual glycan
a facilitating HR/AM MS data
nd corresponding glycoforms.
n, verification/scoring, and
quantification was compared
iginating from Apo CIII.
Results
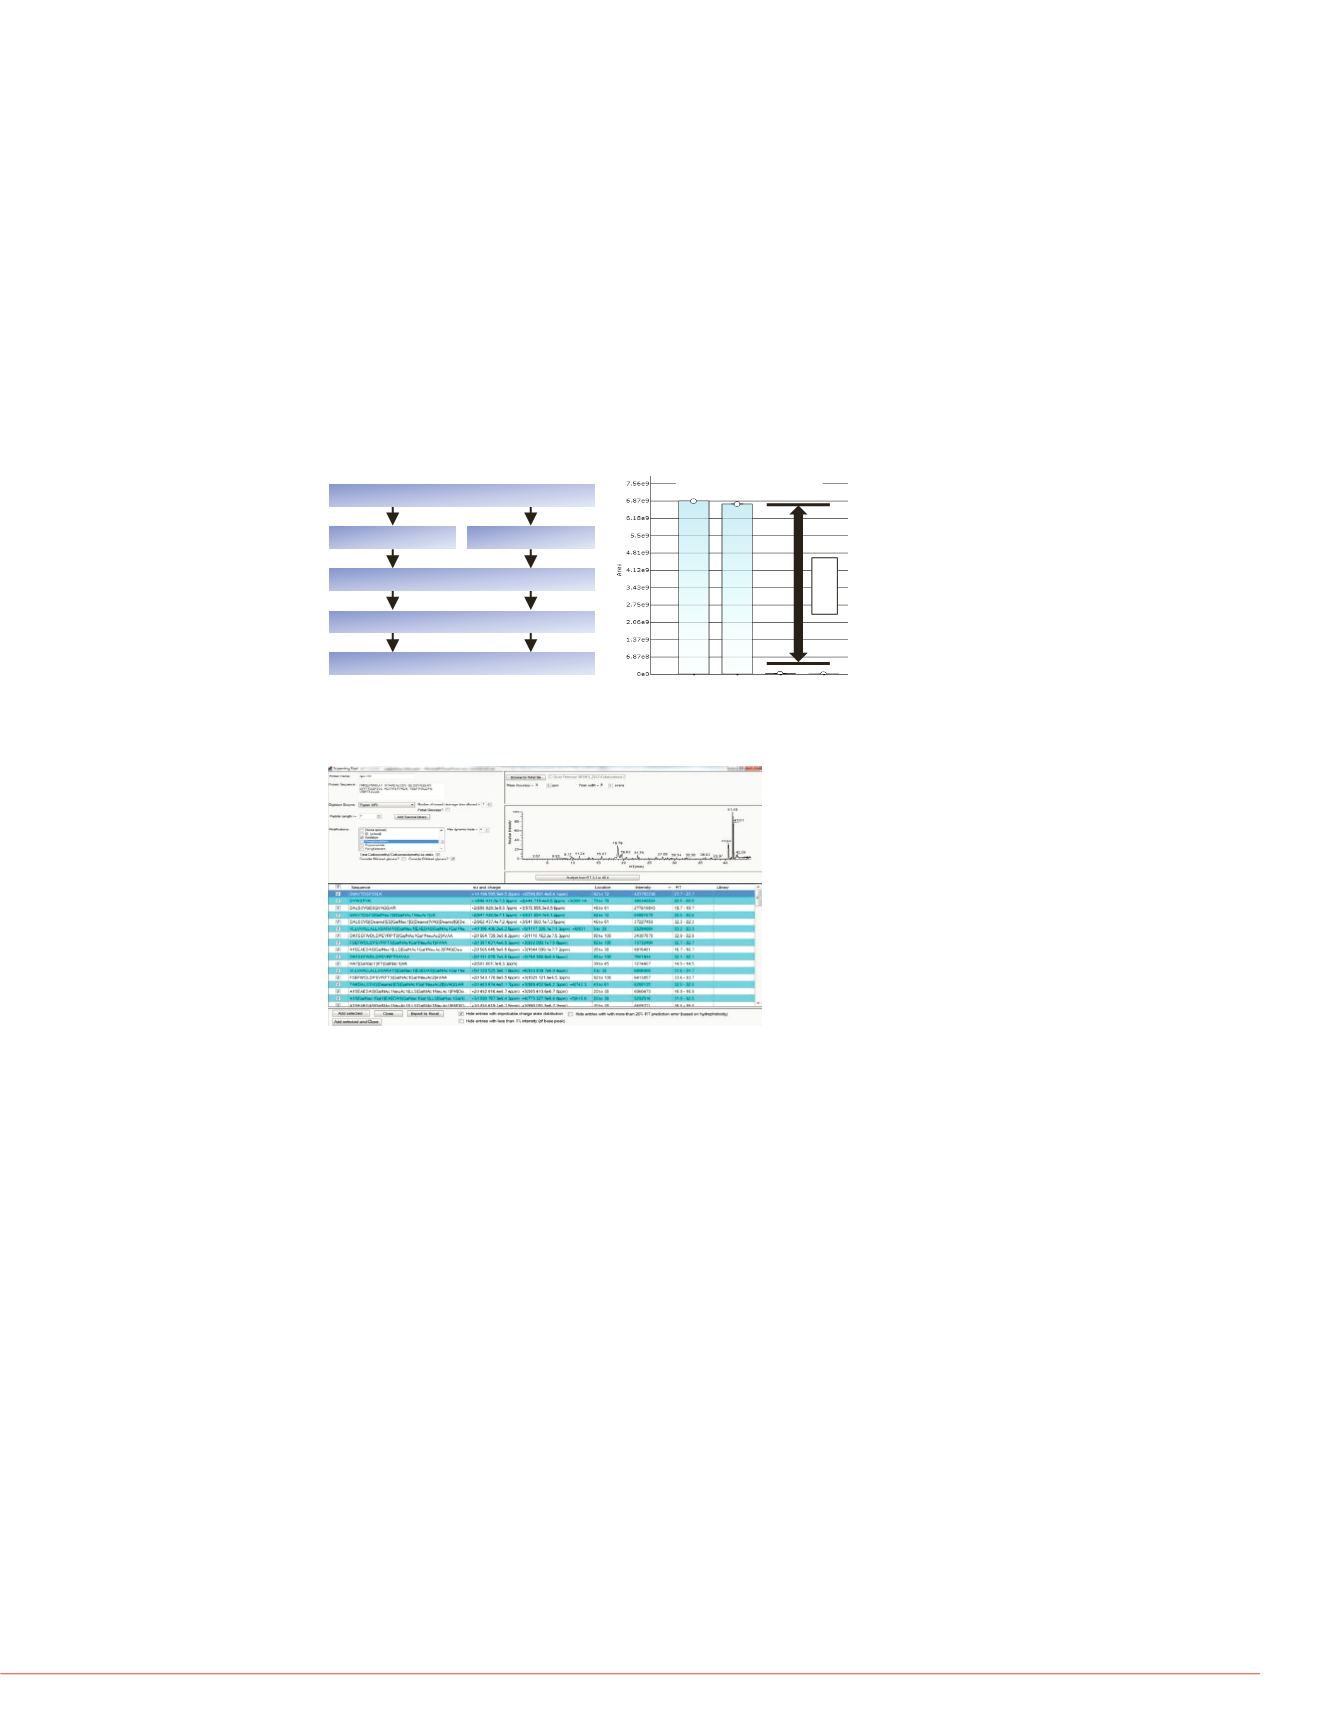
A common stock of serum sample from two different patient types was divided into two
equal aliquots. The only difference was the introduction of an automated IP extraction
using MSIA D.A.R.T. tips loaded with anti-Apo CIII antibody. The histogram for an Apo
CIII tryptic peptide is presented in Figure 1, comparing the measured AUC values with
and without MSIA extraction prior to digestion and LC-MS analysis.
The Pinpoint screening tool utilizes
in-silico
sequence generation to create a list of
unmodified peptides (Figure 2). The list of unmodified peptides are also subjected to
all possible glycan additions (
N
- and/or
O
-linked modifications) to create a master list
of peptides and
m/z
values used to extract data. The resulting table lists the peptide
sequences and modifications as well as all corresponding LC and MS information such
as retention times, precursor charge states, mass errors, and protein sequence
location. The results from the screening tool are directly exported to the Pinpoint main
workbook integrated analysis.
FIGURE 1. Representation of the comparative sample preparation workflow to
evaluate
O
-linked glycopeptide detection and quantification
FIGURE 4. MS-level data analysis
DKFSEFWDLDPEVRPTSAVAA[Gal
overlaid XIC trace for the six isoto
comparative isotopic distribution
extracted as well as serum digest
the integrated peak areas across
FIGURE 3. Plot of measured RT v
peptides and the targeted Apo CII
Position
Targeted Peptide
HF
1–17 SEAEDASLLSFM[Oxid]Q
[Deamid]GYMKHATK
1–17 SEAEDASLLSFMQGYMK 48.99
1–17 SEAEDASLLSFM[Oxid]QGYMK
1–17 SEAEDASLLSFM[Oxid]QGYM
[Oxid]K
18–24 HATKTAK
–2.90
22–40 TAKDALSSVQESQVAQQAR 23.61
24–40 DALSSVQESQVAQQAR
26.27
41–51 GWVTDGFSSLK
34.94
41–60 GWVTDGFSSLKDYWSTVK 44.42
52–58 DYWSTVK
22.67
59–79 DKFSEFWDLDPEVRPTSAVAA 60
61–79 FSEFWDLDPEVRPTSAVAA 45.63
FIGURE 2. Screen capture showing the Pinpoint screening tool used to identify
putative modified and unmodified peptide sequences from a RAW file
Table 1. List of peptides attribute
without standard modifications.
calculated using Krokhinʼs SSRC
coefficient was calculated based
experimental to theoretical value
MS peak profile.
The information generated in the screening provides significant data reduction to
eliminate peptide candidates in the unmodified as well as modified forms. Even for a
small protein such as Apo CIII, which has only 79 residues (omitting the first 20
N
-terminal residues identified as the signaling chain), the use of common
in-silico
processing parameters (common PTMs and 1 missed cleavage) generates over 8,000
possible sequences. The screening tool reduces this list down to 16 peptides in less
than one minute. Enabling the possibility of
O
-linked glycopeptides increases the
number of possible sequences to over 100,000 and provides a list of 92 putative
peptides. The list is further reduced based on the presence of additional retention time
and MS information to a final list that is further evaluated, scored, and quantified in an
automated routine. Table 1 lists the identified set of peptides unmodified or modified
with non
O
-linked glycans. Each peptide has an MS/MS spectrum acquired under the
elution peak profile. The AUC ratios for the list of peptides are close to 1:1 except for
those peptides with missed cleavage sites. Three of the peptides covering residues
22–40, 59–79, and 61–79 show greater response for the “disease” sample compared
to the “normal.” Each of the missed cleavage peptides also shows greater variance
than the tryptic peptides.
The incorporation of the PRTC kit into the mix helps to map the measured RT values
to the expected times. Figure 3 shows the overlap of the PRTC peptides to those of
the Apo CIII peptides. All of the tryptic peptides align with the PRTC peptides except
peptides with missed cleavage sites. The goal is to incorporate additional scoring
metrics to each peptide. In addition, the establishment of a known RT for unmodified
peptides provides landmarks for the
O
-linked glycosylated forms as they are expected
to elute under similar times.
In addition to the peptides listed in T
for the peptides covering residues 2
level data extraction for the 59–79 p
shown in Figure 4. The isotopic distr
match the theoretical distribution wit
overlap for the serum digest sample
relative AUC values for the Control
linked glycopeptide 1.3 matches tha
linked glycoforms were identified for
were identified for the fully tryptic pe
initial screening based on HR/AM M
O
-linked glycopeptides and corresp
of the unmodified peptide when usi
analysis was also calculated for eac
AUC values per isotope are directly
chemical composition of the peptide
intensities.
18–24
4a.
M
4b.
41
GWVTDGFSSLK
51
~100
Serum Samples – Control and Disease
MSIA Extraction
Reduction, Alkylation, and Digestion
HR/AM LC-MS and MS/MS Analysis
Whole Serum
Spike PRTC Kit
MSIA
Control
MSIA
Disease
Serum
Control
Serum
Disease


