3
Thermo Scientific Poster Note
•
PN ASMS13_WP24_ZHao_e 06/13S
lution for monoclonal antibody (mAb)
an column technology and a Thermo
ntly developed high-performance
GlycanPac™ AXH-1 column. A data-
HCD) method was performed in negative
rates glycans with unique selectivity
workflow solution was developed for
technology and a bench-top Orbitrap LC-
to antibody glycoform characterization.
tion were achieved for released glycans
l antibody.
of antibody therapeutics, the FDA
lation be maintained for recombinant
he system in which they are produced.
f glycans pose significant analytical
rization. Liquid chromatography (LC)
ged as one of the most powerful tools for
umn is a high-performance
r structural, qualitative and quantitative
for biologically relevant glycans
ed or native and is designed for high-
rescence or LC-MS methods. Because
hilic interaction liquid chromatography
itterionic packing materials are often
te glycans mainly by hydrogen bonding,
ation. Identification of the glycan charge
AXH-1 column overcomes these
charge, size and polarity configuration.
resolution. In this study, we
a glycoprotein standard and a
sing the new column technology and
s or mAb with PNGase F enzyme. The
benzamide (2-AB) label group with
developed high-performance
a Thermo Scientific™ Dionex™ Ultimate
detector.
wift RP-10R monolithic column (1 x 50
.1% formic acid in H
2
O (Solvent A) and
lumn was heated to 80 °C during
ion of 1 µg mAb, a 15 min gradient was
20%B; 1.0 min, 35%B; 3.0 min, 55%B;
B; 15.0 min, 20%B).
iation (HCD) method was performed in
following MS and MS/MS settings were
as acquired at 70,000 resolution at
m/z
cquired at 17,500 resolution at
m/z
200
alyzed by ESI-MS for intact molecular
flow rate was set at 10. Auxiliary gas
as 275 °C. S-lens level was set at 55.
solution was 17,500 for intact mAb. The
s set at 250 ms.
Figure 4. Observed molecular mass of gl
forms of a intact monoclonal antibody. S
glycoforms have an observed mass erro
potentially double fucosylated peaks tha
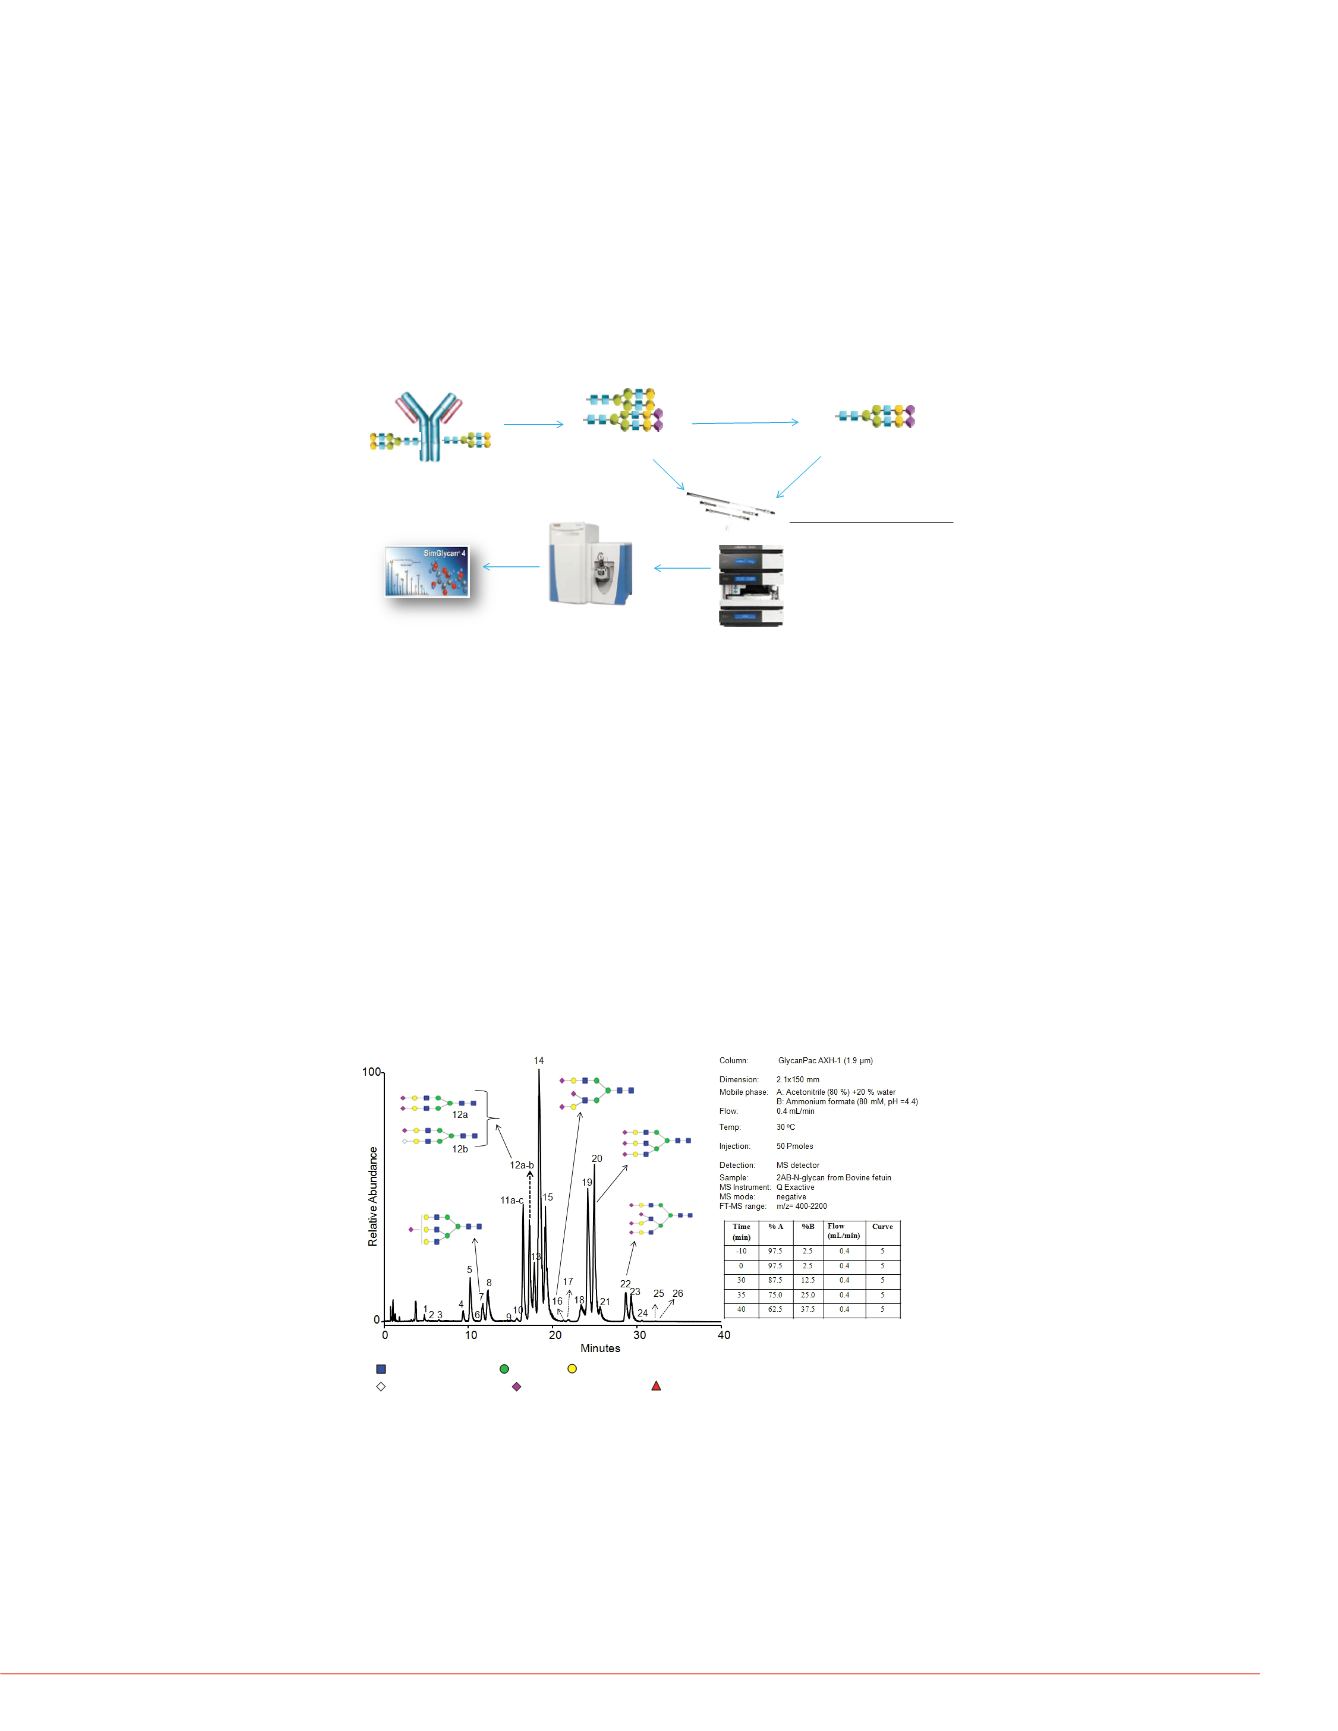
Figure 1. A complete LC-MS/MS workflow solution for monoclonal antibody
glycan profiling
Results
Separation of Glycans Based on Charge, Size and Polarity
The GlycanPac AXH-1 column can be used for qualitative, quantitative, structural
analysis and characterization of uncharged (neutral) and charged glycans present in
proteins. The separation and elution of glycans are based on charge; the neutral
glycans elute first, followed by the separation of acidic glycans from mono-sialylated,
di-sialylated, tri-sialylated, tetra-sialylated and finally penta-sialylated species. Glycans
of each charge state are further separated based on their size and polarity. In this
study, the structure of glycans present in each peak was determined using high
resolution LC-MS/MS. As shown in Figure 2, the detailed structural information
obtained from the MS/MS data validated the ability of GlycanPac AXH-1 column to
separate labeled N-glycans based on charge, size and polarity. However, co-elution of
different charge state glycans is common with other commercially available HILIC
column as shown in Figure 3.
Figure 2. LC-MS analysis of 2-AB labeled N-glycans from bovine fetuin by
GlycanPac AXH-1 (1.9 µm) column with MS detection.
Figure 3. LC-MS analysis of 2-AB labele
commercial amide HILIC column (1.7 µm
The GlycanPac AXH-1 column is also well s
separation and analysis of native glycans fr
unlabeled glycans not only eliminates the e
cleanup methods during labeling, but also r
adding further ambiguity imposed by the la
Monoclonal antibody (mAb) glycan profi
high resolution LC-MS/MS
Intact mass measurement of a monoclonal
the combination of any two of the three N-gl
mass errors for some of the intact glycofor
(Figure 4A) which is larger than the <10 pp
shown). Furthermore, the intact mass error
was within 10 ppm (Figure 4B), suggesting
molecule that were not detected at the intac
intact mass of the major glycoforms. To furt
glycans from this protein were separated us
separation and elution of glycans from Glyc
with neutral glycans eluting first, followed b
each charge state are further separated ba
G0F/G0F
-3.4ppm
-6.8ppm
G0F/G1F
G1F/G1F (orG0F/G2F)
-8.4ppm
G1F/G2F
-25.4ppm
G2F/G2F
-57.3ppm
? ?
Mass error larger
than expected
1800
2000
2200
2400
2600
2800
3000
3200
3400
3600
3800
m/z
0
10
20
30
40
50
60
70
80
90
100
Relative Abundance
2907.25
2797.59
3025.87
3088.89
2745.82
2695.90
2968.59
3154.57
2647.78
3223.15
2601.35
3294.72
2556.54
2513.21
3369.59
2430.84
3447.92
2353.71
3529.93
2246.72
3616.00
2149.04
3801.463901.52
2003.93
1899.12
G0F+G1F
G1F+G2F
G0F+G0F
G0+G0F
G0F+G2F
A
deconvolution
A
Full MS spectrum of mAb
Data analysis
SimGlycan® software from PREMIER Biosoft was used for glycan identification and
structural elucidation
2
. SimGlycan software accepts raw data files from Thermo
Scientific mass spectrometers and elucidates the associated glycan structure by
database searching and scoring techniques.
Full MS spectra of mAb were analyzed using Thermo Scientific™ Protein
Deconvolution™ 2.0 software. Mass spectra for deconvolution were produced by
averaging spectra across the most abundant portion of the elution profile for the mAb.
A minimum of at least 8 consecutive charge states from the input
m/z
spectrum were
used to produce a deconvoluted peak. To identify glycoforms, the masses were
compared to the expected masses of various combinations of commonly found
glycoforms
N-Acetyl-Glucosamine
(GlcNAc),
Mannose
(Man)
,
Galactose
(Gal)
N-AcetylNeuraminicAcid
(Neu5Ac)
,
N-Glycolyl-NueraminicAcid
(Neu5Gc)
,
L-Fucose
(L-Fuc)
N-Acetyl-Glucosamine
(GlcNAc),
Mannose
(Man)
,
Galactose
(Gal)
N-AcetylNeuraminicAcid
(Neu5Ac)
,
N-Glycolyl-NueraminicAcid
(Neu5Gc)
,
Native glycans
Labeled glycans
SimGlycan
software
2AB/2AA labeling
2AB
GlycanPac AXH-1 solumn
Ultimate 3000
UHPLC
The Q Exactive MS
Separation
of glycans
LC-MS
analysis
PNGase F
digestion


