5
Thermo Scienti c Poster Note
•
PN ASMS13_Th385_SPeterman_E 07/13S
Conclusion
The targeted protein workflow
quantification of Apo CIII acros
provides significant advantage
landmarks for modified peptide
Incorporation of MSIA enri
whole serum digest analys
Unbiased HR/AM MS and
facilitates post-acquisition
The Pinpoint screening to
unmodified targeted pepti
Pinpoint data processing i
increasing confidence in t
References
1. Maeda, H.; Hashimoto, R
1987,
28(12),
1405–1409
2. Zhao, P.; Viner, R.; Teo,
2011,
10(9),
4088–4104.
3. Nedelkov, D.; Kiernan, U.
PNAS
2005,
102(31),
108
Acknowledgem
We would like to thank Dr. Min
providing the samples used in t
In addition to MS data, product ion data was evaluated to provide additional
confidence to the assigned glycopeptide sequence. Figure 6 shows an example of
automated product ion determination used to distinguish each base peptide and
glycan composition. Acquiring the product ion spectra in the Thermo Scientific™
Orbitrap™ instrument facilitated product ion charge state and accurate
m/z
value
determination, which significantly increased product ion assignment based on the
peptide sequence and proposed glycan composition identified from the screening tool.
The key fragments used to confirm the base peptide sequence was
m/z
2137 for the
61–79 peptide and
m/z
2381 fragment for the 59–79 peptides assigned as the base
peptide sequence. The mass errors calculated for each fragment ion was less than 5
ppm. Due to the degree of sequence overlap attributed to the missed cleavage site,
additional product ions were used to further confirm the sequence, specifically the b-
type ions. Similar data analysis was completed for each glycoform. The results for the
O
-glycoform distribution are presented in Figure 7. The unmodified forms of the
peptide (with and without missed cleavage site) showed a lower relative response
compared to the modified forms.
Incorporation of HR/AM MS HCD data acquisition facilitates peptide sequence
determination and glycan composition, and for those
O
-linked glycopeptides modified
at only one residue, site determination. For glycoforms modified at multiple sites,
specific site determination generally requires electron transfer dissociation (ETD)
product ion data collection. The workflow presented here can automatically create a
secondary experimental method for targeted ETD data acquisition.
d glycopeptide
uAc1]. Figure 4a shows the
charge state. Figure 4b shows
ss each sample – MSIA
responding histogram comparing
FIGURE 7. Comparative distr
from Apo CIII. Integrated pea
comparison of glycoform dis
each sample.
ction of HF values for the PRTC
m Table 1.
UC Serum AUC MSIA AUC
Ratio
Dot-
Product
trol Disease Control Disease
+03 N/A 1.6E+07 9.2E+06 0.59 0.99
+06 1.0E+05 3.1E+09 3.1E+09 1.01 1.00
+05 N/A 1.2E+09 1.3E+09 1.07 1.00
+05 2.7E+05 4.5E+08 5.3E+08 1.19 1.00
+03 1.3E+04 3.5E+06 2.9E+06 0.84 1.00
A N/A 1.4E+07 1.8E+07 1.35 0.98
+07 2.7E+07 1.1E+10 1.1E+10 0.97 1.00
+07 7.0E+06 6.9E+09 6.7E+09 0.98 1.00
+04 1.9E+05 2.0E+07 2.0E+07 1.02 1.00
+07 1.1E+07 6.1E+09 5.6E+09 0.92 0.89
+05 8.0E+04 1.7E+08 2.5E+08 1.45 1.00
A N/A 6.5E+07 9.1E+07 1.38 0.99
1097.5951
1000
1200
1400
1600
1800
2000
2200
2400
m/z
0
10
20
30
40
50
60
70
80
90
100
0
10
20
30
40
50
60
70
80
90
100
Relative Abundance
z=1
1300.6719 z=1
1212.6249 z=1
2137.0342 z=1
937.5073 z=1
975.5097z=1
1440.7351 z=1
1325.7135 z=1
1074.5771 z=1
1462.7117 z=1
1137.5757 z=1
1521.7097 z=1
1626.8059 z=1
1977.9579 z=1
2047.9893 z=1
1644.7979 z=1
1877.8766 z=1
1097.5962
z=1
1283.5591 z=1
1191.0781 z=2
1300.6751 z=1
1055.4452 z=1
1440.7339 z=1
1168.5334 z=1
937.5101z=1
1626.8165 z=1
1212.6221 z=1
1462.7283 z=1
2381.1536 z=1
1773.8883 z=1
1990.9480 z=1
1643.8187 z=1
1528.7921 z=1
1829.8912 z=1
2221.0483 z=1
2137.0229 z=1
2292.1145 z=1
1902.9080 z=1
NL: 4.54E5
NL: 1.49E6
1325.7135 z=1
y16
y18
y19
b19
b20
y17
y15
y14
y13
b10
y12
y11
b8
b9
y14 + GalNAc
y13 + GalNAc
y11 + GalNAc
y11 + GalNAcGal
y15 + GalNAc
y11
y12
y15
y14
y13
y14 + GalNAc
Base Peptide
y11 + GalNAc
y11 + GalNAcGal
b16
b12
b17
b18
y9 + GalNAc
b9
y8 + GalNAc
Base Peptide
FSEFWDLDPEVRPTSAVAA [GalNAcGalNeuAc]
+3
DKFSEFWDLDPEVRPTSAVAA [GalNAcGalNeuAc]
+3
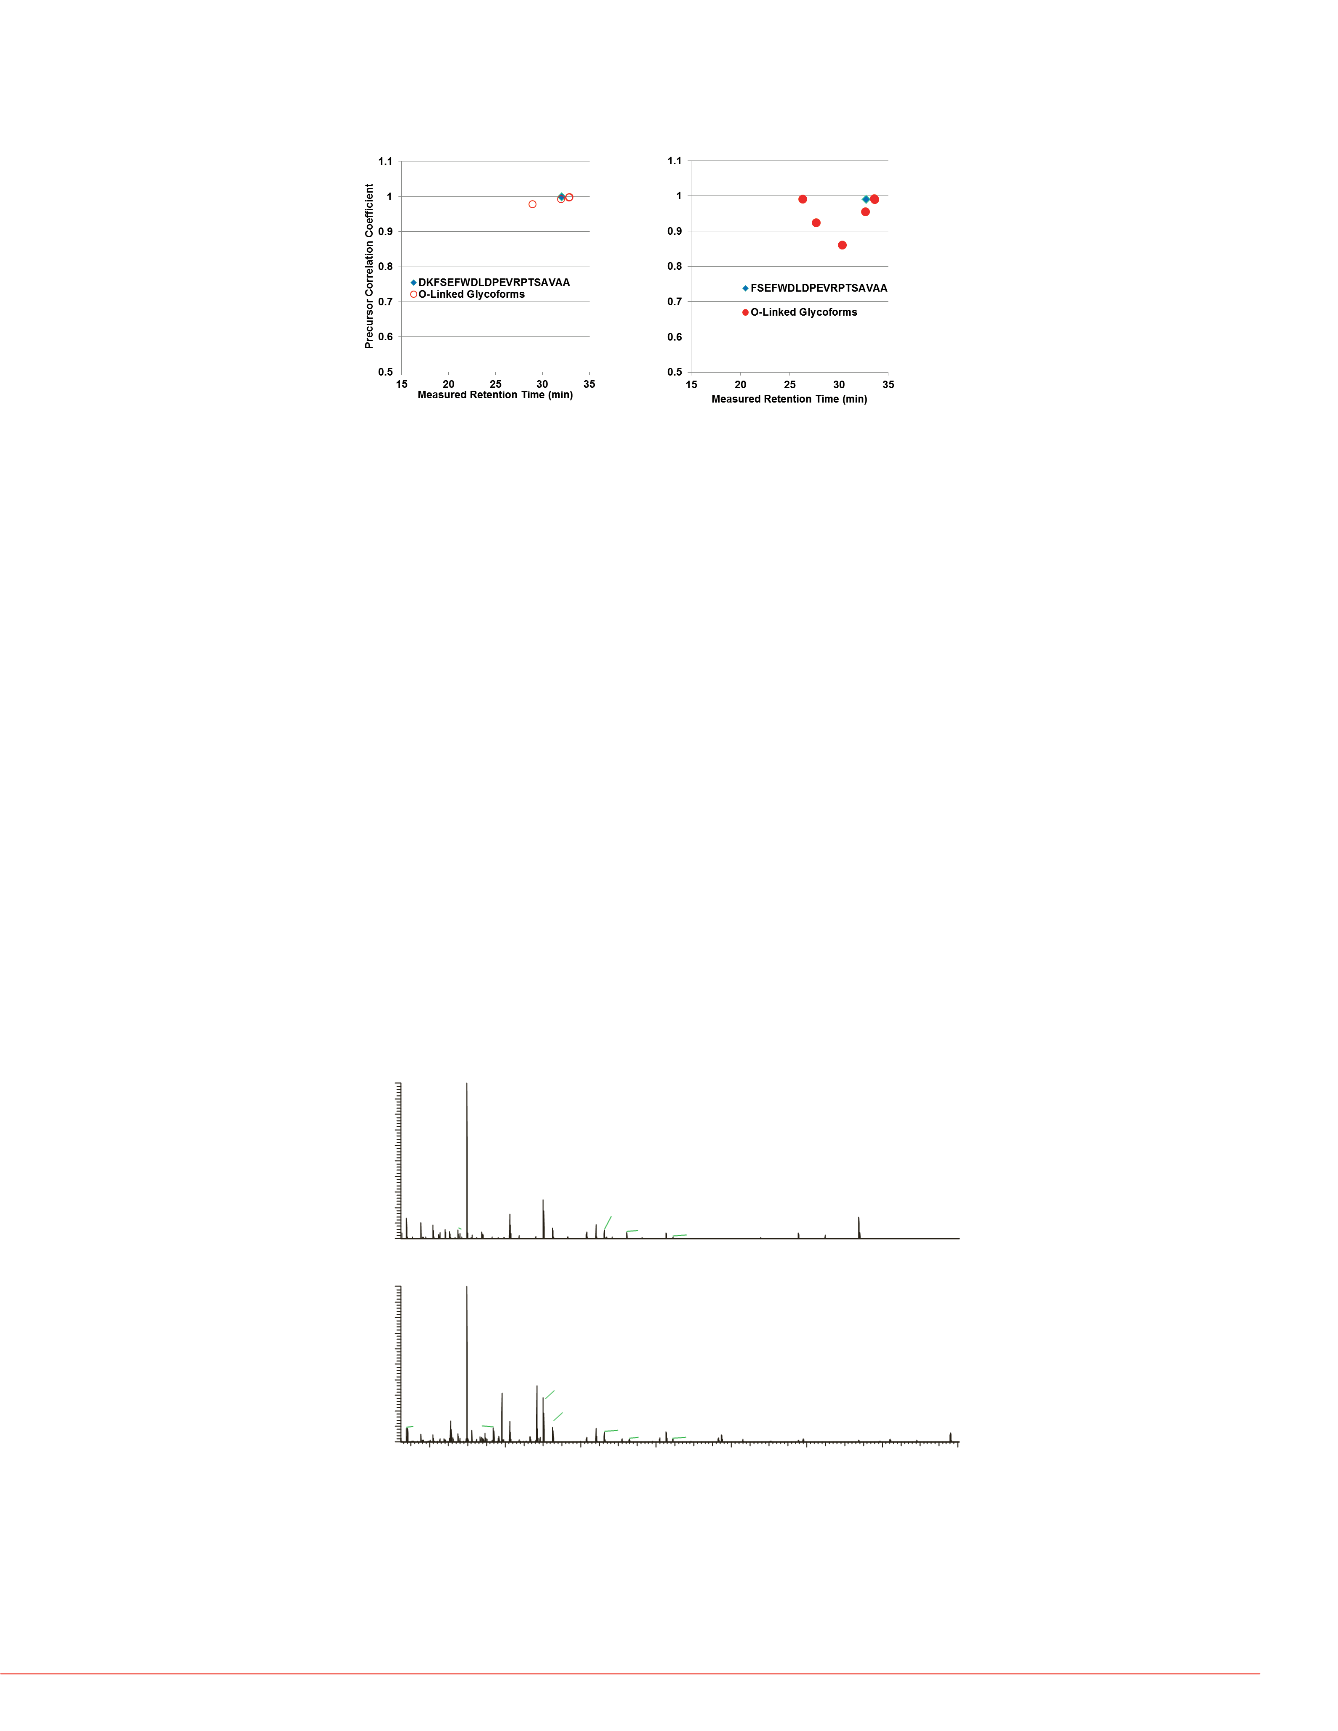
FIGURE 5. Comparative plots of the dot-product correlation coefficients as
a function of measured retention times for the identified glycoforms for
DKFSEFWDLDPEVRPTSAVAA and FSEFWDLDPEVRPTSAVAA.
c digestion of Apo CIII with and
bicity factors (HF) were
and the dot product correlation
isotopic distribution overlap of
were determined based on the
d glycopeptides were also identified
and 61–79. An example of the MS-
d with GalNAc1Gal1NeuAc1 is
s for the MSIA extracted samples
oefficients >0.98. The isotopic
response. Figure 4c shows the
mples. The AUC ratio for the
O
-
dified peptide. Three additional
O
-
tide and five
O
-linked glycoforms
igure 5 shows the results of the
tention time correlation. The group of
rms should elute in proximity (<20%)
d column. The isotopic distribution
he goodness of fit for the relative
the mass accuracy of the predicted
s well as the overall measured
FIGURE 6. Comparative product ion spectra for the
O
-linked glycopeptides
FSEFWDLDPEVRPTSAVAA and DKFSEFWDLDPEVRPTSAVAA with the same
glycan modification. Both HR/AM HCD spectra were acquired under the
precursor elution profiles.
All trademarks are the property of Therm
This information is not intended to encou
intellectual property rights of others.
59–79
A+3 A+4 A+5
MSIA Control
MSIA Disease
Serum Disease
Serum Control
Theoretical
4c.


