4
Targeted Quanti cation of O-Linked Glycosylation Site for Glycan Distribution Analysis
nt patient types was divided into two
ction of an automated IP extraction
antibody. The histogram for an Apo
ring the measured AUC values with
LC-MS analysis.
nce generation to create a list of
fied peptides are also subjected to
odifications) to create a master list
he resulting table lists the peptide
ponding LC and MS information such
errors, and protein sequence
irectly exported to the Pinpoint main
In addition to MS data, product
confidence to the assigned gly
automated product ion determi
glycan composition. Acquiring t
Orbitrap™ instrument facilitate
determination, which significant
peptide sequence and propose
The key fragments used to con
61–79 peptide and
m/z
2381 fr
peptide sequence. The mass e
ppm. Due to the degree of seq
additional product ions were us
type ions. Similar data analysis
O
-glycoform distribution are pr
peptide (with and without miss
compared to the modified form
Incorporation of HR/AM MS H
determination and glycan comp
at only one residue, site deter
specific site determination gen
product ion data collection. The
secondary experimental metho
sample preparation workflow to
quantification
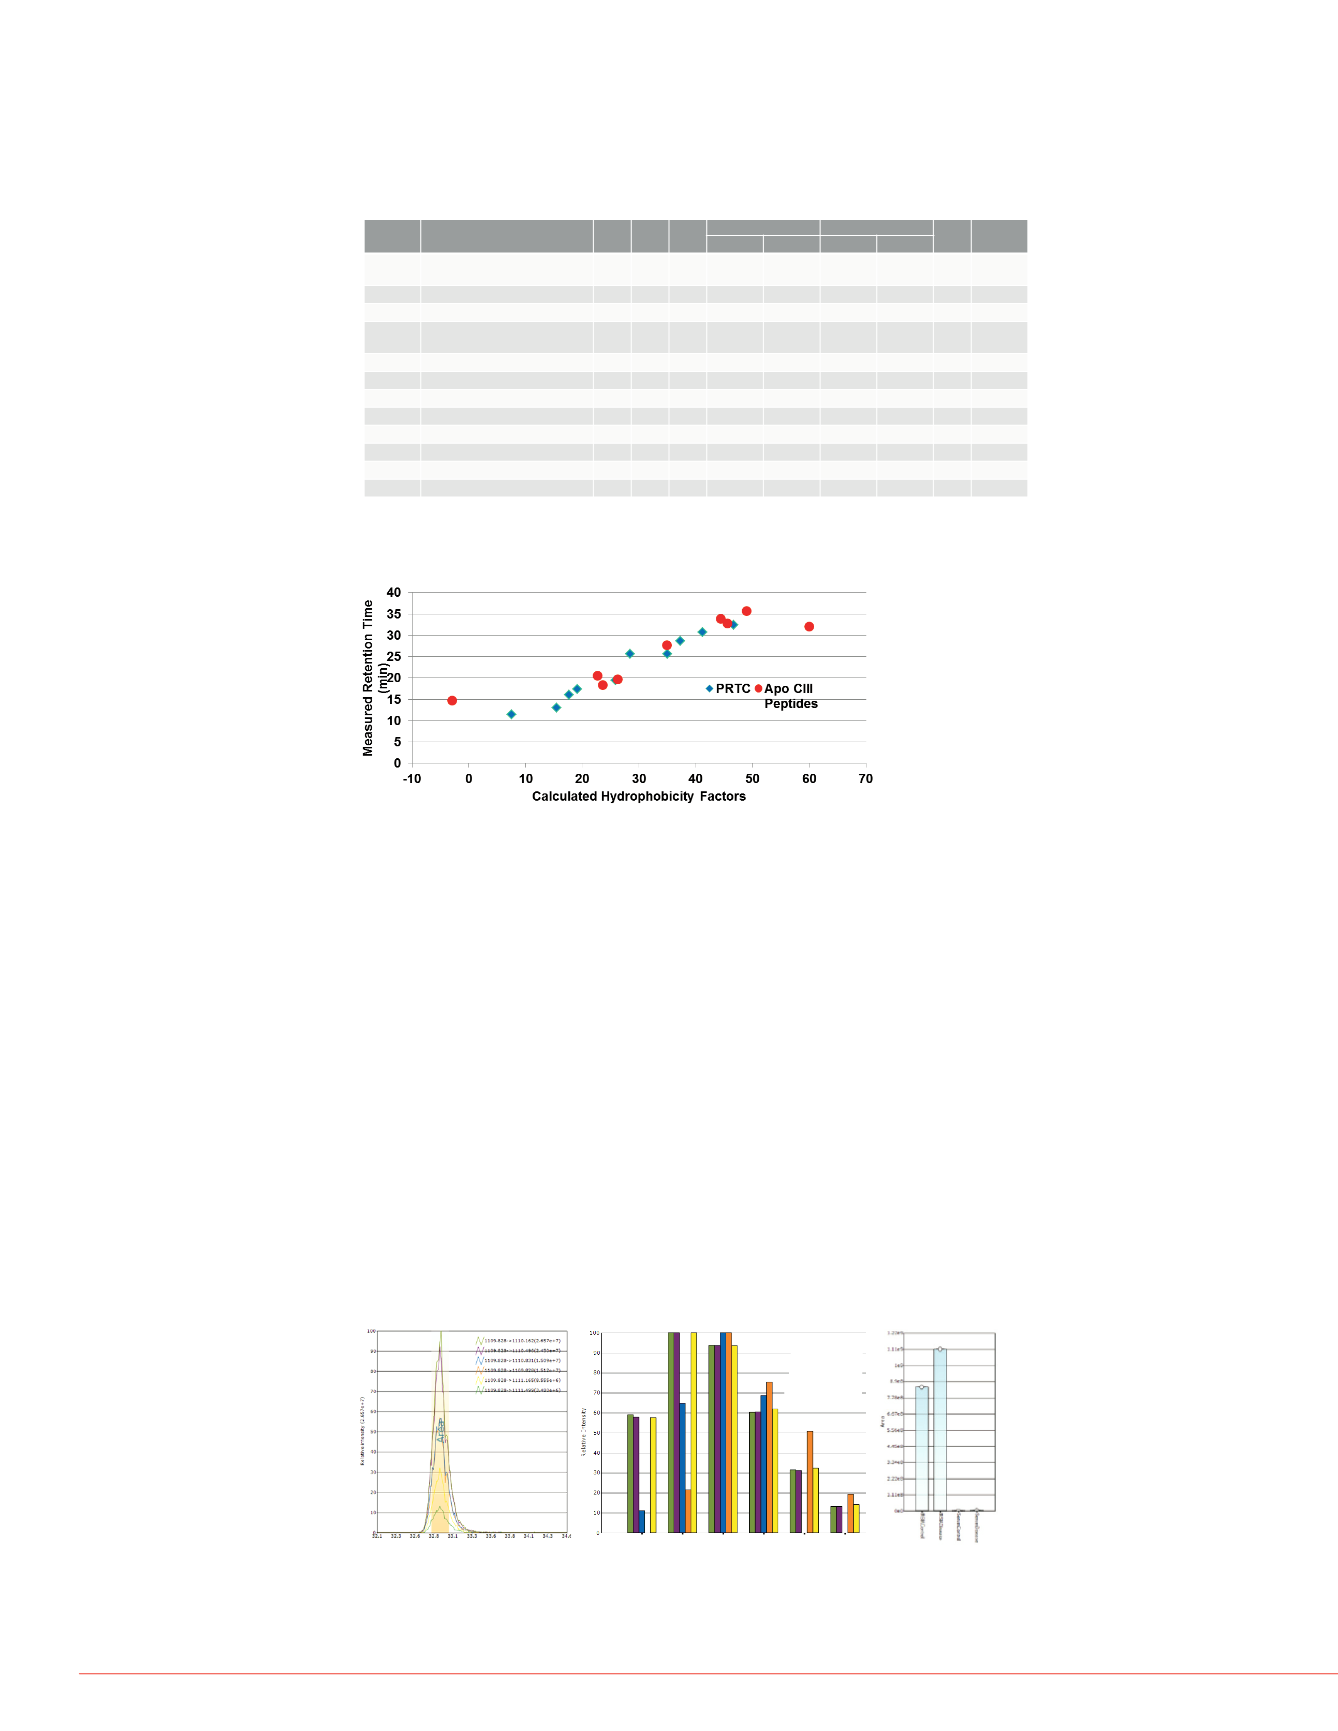
FIGURE 4. MS-level data analysis of the
O
-linked glycopeptide
DKFSEFWDLDPEVRPTSAVAA[GalNAc1Gal1NeuAc1]. Figure 4a shows the
overlaid XIC trace for the six isotopes of the +3 charge state. Figure 4b shows
comparative isotopic distribution analysis across each sample – MSIA
extracted as well as serum digests and the corresponding histogram comparing
the integrated peak areas across each sample.
FIGURE 3. Plot of measured RT values as a function of HF values for the PRTC
peptides and the targeted Apo CIII peptides from Table 1.
Position
Targeted Peptide
HF %CV RT
(min)
AUC Serum AUC MSIA AUC
Ratio
Dot-
Product
Control Disease Control Disease
1–17 SEAEDASLLSFM[Oxid]Q
[Deamid]GYMKHATK
26 24.33 3.7E+03 N/A 1.6E+07 9.2E+06 0.59 0.99
1–17 SEAEDASLLSFMQGYMK 48.99 0.5 35.68 1.2E+06 1.0E+05 3.1E+09 3.1E+09 1.01 1.00
1–17 SEAEDASLLSFM[Oxid]QGYMK
3 32.3 9.5E+05 N/A 1.2E+09 1.3E+09 1.07 1.00
1–17 SEAEDASLLSFM[Oxid]QGYM
[Oxid]K
9 26.24 9.4E+05 2.7E+05 4.5E+08 5.3E+08 1.19 1.00
18–24 HATKTAK
–2.90 9 14.7 9.3E+03 1.3E+04 3.5E+06 2.9E+06 0.84 1.00
22–40 TAKDALSSVQESQVAQQAR 23.61 15 18.29 N/A N/A 1.4E+07 1.8E+07 1.35 0.98
24–40 DALSSVQESQVAQQAR
26.27 2 19.7 4.9 E+07 2.7E+07 1.1E+10 1.1E+10 0.97 1.00
41–51 GWVTDGFSSLK
34.94 1 27.65 2.0E+07 7.0E+06 6.9E+09 6.7E+09 0.98 1.00
41–60 GWVTDGFSSLKDYWSTVK 44.42 1 33.85 1.8E+04 1.9E+05 2.0E+07 2.0E+07 1.02 1.00
52–58 DYWSTVK
22.67 4 20.53 2.4E+07 1.1E+07 6.1E+09 5.6E+09 0.92 0.89
59–79 DKFSEFWDLDPEVRPTSAVAA 60 18 32.08 6.8E+05 8.0E+04 1.7E+08 2.5E+08 1.45 1.00
61–79 FSEFWDLDPEVRPTSAVAA 45.63 16 32.8 N/A N/A 6.5E+07 9.1E+07 1.38 0.99
1097.5951
1000
1200
1400
0
10
20
30
40
50
60
70
80
90
100
0
10
20
30
40
50
60
70
80
90
100
Relative Abundance
z=1
1300.6719 z=1
1212.6249 z=1
937.5073 z=1
975.5097z=1
1440.7351 z=1
1325.7135 z=1
1074.5771 z=1
1137.5757 z=1
1097.5962
z=1
1283.5591 z=1
1191.0781 z=2
1300.6751 z=1
1055.4452 z=1
1440.7339 z=1
1168.5334 z=1
937.5101z=1
1212.6221 z=1
1325.7135 z=1
y14
y13
b10
y12
y11
b8
b9
y11 + GalNAc
y11
y12
y14
y13
y11 + GalNAc
y11 + GalNAcGal
y9 + GalNAc
b9
y8 + GalNAc
FIGURE 5. Comparative plots
a function of measured reten
DKFSEFWDLDPEVRPTSAVA
nt screening tool used to identify
uences from a RAW file
Table 1. List of peptides attributed to the tryptic digestion of Apo CIII with and
without standard modifications. The hydrophobicity factors (HF) were
calculated using Krokhinʼs SSRCalc algorithm and the dot product correlation
coefficient was calculated based on precursor isotopic distribution overlap of
experimental to theoretical values. AUC values were determined based on the
MS peak profile.
es significant data reduction to
well as modified forms. Even for a
residues (omitting the first 20
in), the use of common
in-silico
sed cleavage) generates over 8,000
his list down to 16 peptides in less
ed glycopeptides increases the
d provides a list of 92 putative
presence of additional retention time
luated, scored, and quantified in an
f peptides unmodified or modified
S/MS spectrum acquired under the
eptides are close to 1:1 except for
of the peptides covering residues
for the “disease” sample compared
ides also shows greater variance
s to map the measured RT values
of the PRTC peptides to those of
gn with the PRTC peptides except
o incorporate additional scoring
ent of a known RT for unmodified
osylated forms as they are expected
In addition to the peptides listed in Table 1,
O
-linked glycopeptides were also identified
for the peptides covering residues 22–40, 59–79, and 61–79. An example of the MS-
level data extraction for the 59–79 peptide modified with GalNAc1Gal1NeuAc1 is
shown in Figure 4. The isotopic distribution profiles for the MSIA extracted samples
match the theoretical distribution with correlation coefficients >0.98. The isotopic
overlap for the serum digest samples shows little response. Figure 4c shows the
relative AUC values for the Control vs. Disease samples. The AUC ratio for the
O
-
linked glycopeptide 1.3 matches that for the unmodified peptide. Three additional
O
-
linked glycoforms were identified for the 59–71peptide and five
O
-linked glycoforms
were identified for the fully tryptic peptide 61–71. Figure 5 shows the results of the
initial screening based on HR/AM MS data and retention time correlation. The group of
O
-linked glycopeptides and corresponding glycoforms should elute in proximity (<20%)
of the unmodified peptide when using a C18-based column. The isotopic distribution
analysis was also calculated for each glycoform. The goodness of fit for the relative
AUC values per isotope are directly dependent on the mass accuracy of the predicted
chemical composition of the peptide and glycan as well as the overall measured
intensities.
FIGURE 6. Comparative prod
FSEFWDLDPEVRPTSAVAA a
glycan modification. Both H
precursor elution profiles.
59–79
18–24
4a.
Mono A+1 A+2 A+3 A+4 A+5
MSIA Control
MSIA Disease
Serum Disease
Serum Control
Theoretical
4b.
4c.
WVTDGFSSLK
51
~100
l
MSIA
Disease
Serum
Control
Serum
Disease


