6
A Complete Workflow Solution for Monoclonal Antibody Glycoform Characterization Combininga Novel Glycan Column Technology and
Bench-Top Orbitrap LC-MS/MS
peak was performed by Full MS and data
information-rich HCD spectra contain fragment ions
-ring and glycosidic bond fragmentations (Figure 6).
e found from this monoclonal antibody, the majority
cluding G0F, G1F and G2F which were also the
tact protein level for this antibody (Figure 4A). Also
ucosylated forms of G1 and G2, minor amounts of
ecies with and without fucosylation, as well as
e not identified at the intact protein level (Figure 7).
14
16
18
20
e (min)
14.58
16.65
3.28
15.15
17.92
19.81 20.79
14.51 15.98 16.54 17.91
19.79 20.68
14.05 14.65 15.84 17.26 18.76
21.10
20.01
G2F
neutral N-glycans on GlycanPac AXH-1
Figure 7. Identified glycans from monoclonal antibody
Conclusion
GlycanPac AXH-1 column separates glycans with unique selectivity based on
charge, size and polarity.
The GlycanPac AXH-1 columns are compatible with MS instruments. LC-ESI-FTMS
or FT-MS/MS analysis of both native and labeled glycans from proteins and
antibodies were carried out successfully using GlycanPac AXH-1 columns.
Confident identification and structural confirmation of glycans can be achieved
using high-resolution HCD MS/MS which produces an informative spectrum
containing glycosidic and cross ring fragment ions.
A complete workflow solution was developed for glycan profiling combining the
unique GlycanPac AXH-1 column technology and a bench-top Orbitrap LC-MS/MS.
This workflow was applied to characterize a monoclonal antibody glycoforms.
Confident identification and structural confirmation was achieved for released
glycans from the monoclonal antibody.
References
1. Bigge, J. C. et al., Non-selective and efficient fluroscent labeling of glycans using
2-amino benzamide and anthranilic acid. Analytical Biochemistry,
1995
,
230
, 229-
238.
2.
Apte, A and Meitei, N.S., Bioinformatics in glycomics: glycan characterization with
mass spectrometric data using SimGlycan,
2010
,
600
, 269-81.
ural confirmation of released glycan using high
Percentage match (%) of theoretical fragments
32.14
30.95
20.21
14.95
SimGlycan is a registered trademark of PREMIER Biosoft International. All other trademarks are the property of
Thermo Fisher Scientific and its subsidiaries.
This information is not intended to encourage use of these products in any manners that might infringe the
intellectual property rights of others.
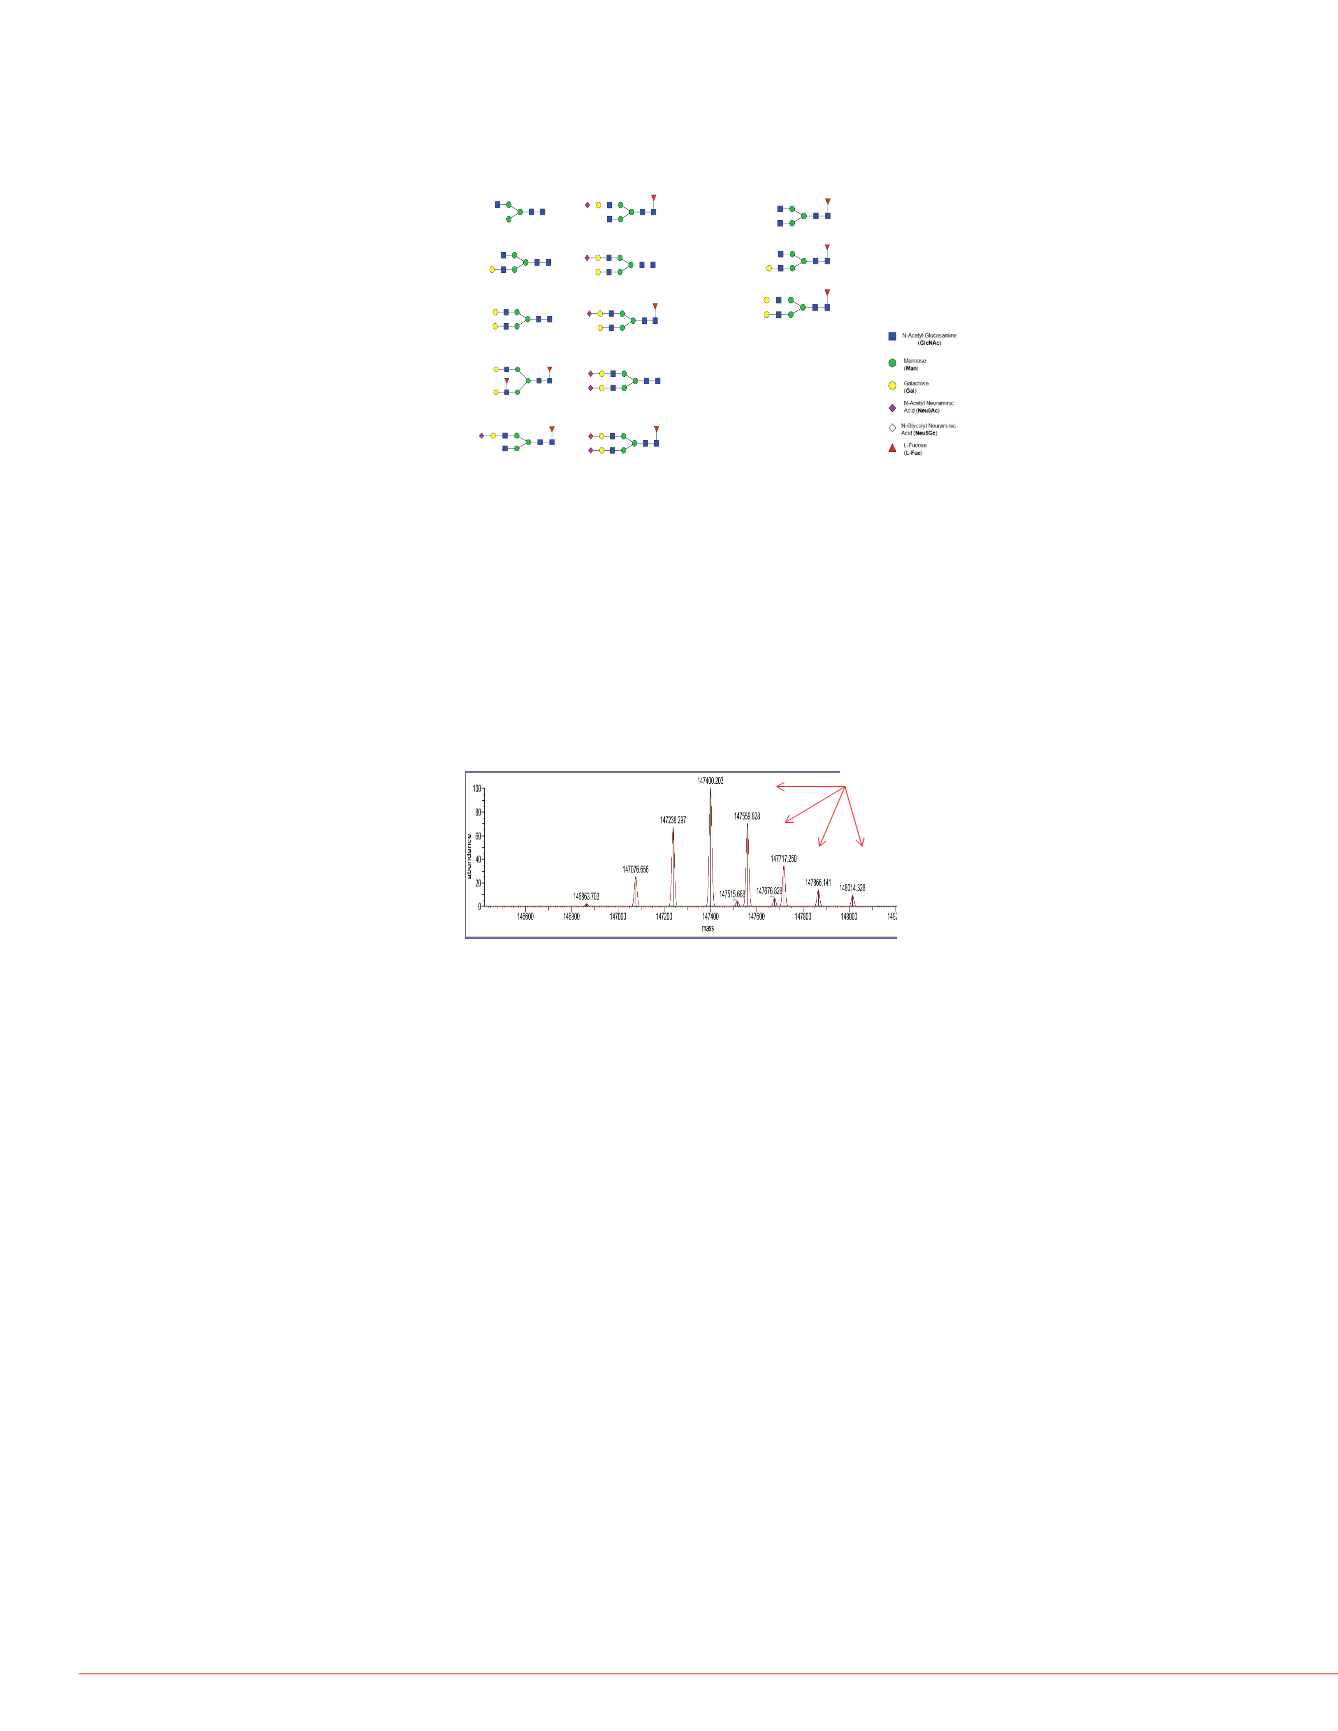
Glycans identified both at intact
protein level and in released form
Glycans identified
only in released form
G0F/G0F
-3.4ppm
-6.8ppm
G0F/G1F
G1F/G1F (orG0F/G2F)
-8.4ppm
G1F/G2F
-25.4ppm
G2F/G2F
-57.3ppm
? ?
G2F2/G2F2
G2F/G2F2
-24.7ppm -36.8ppm
Figure 8 Annotated glycoforms of a monoclonal antibody
Mass error caused by
interfering minor glycoforms
containing sialic acid
These results explain that the unexpected mass error observed previously is due to the
interfering minor glycoforms that have a molecular mass close to the major ones. In the
deconvoluted MS spectrum, the base of the antibody major glycoform peaks covers a
mass range of about 40 Da due to the distribution of the unresolved isotopic peaks of a
large protein of this size. Therefore any interfering species within 20 Da of mass
difference would cause a mass shift of the major glycoform peaks, rather than forming a
separate peak. For example, in this case, the replacement of a Fuc and a Gal by
Neu5Ac, which would have a mass difference of -17Da, could cause the negative mass
shift observed in this study, especially when the interfering species is relatively low in
abundance (Figure 8). Results in this study indicate that rapid and sensitive antibody
glycan profiling can be achieved using GlycanPac AXH-1 column and HR/AM Orbitrap
LC-MS/MS.
togram of the neutral glycans
D spectrum of G2F


