3
Thermo Scientific Poster Note
•
BioPharma_PN63712
_E 11/13S
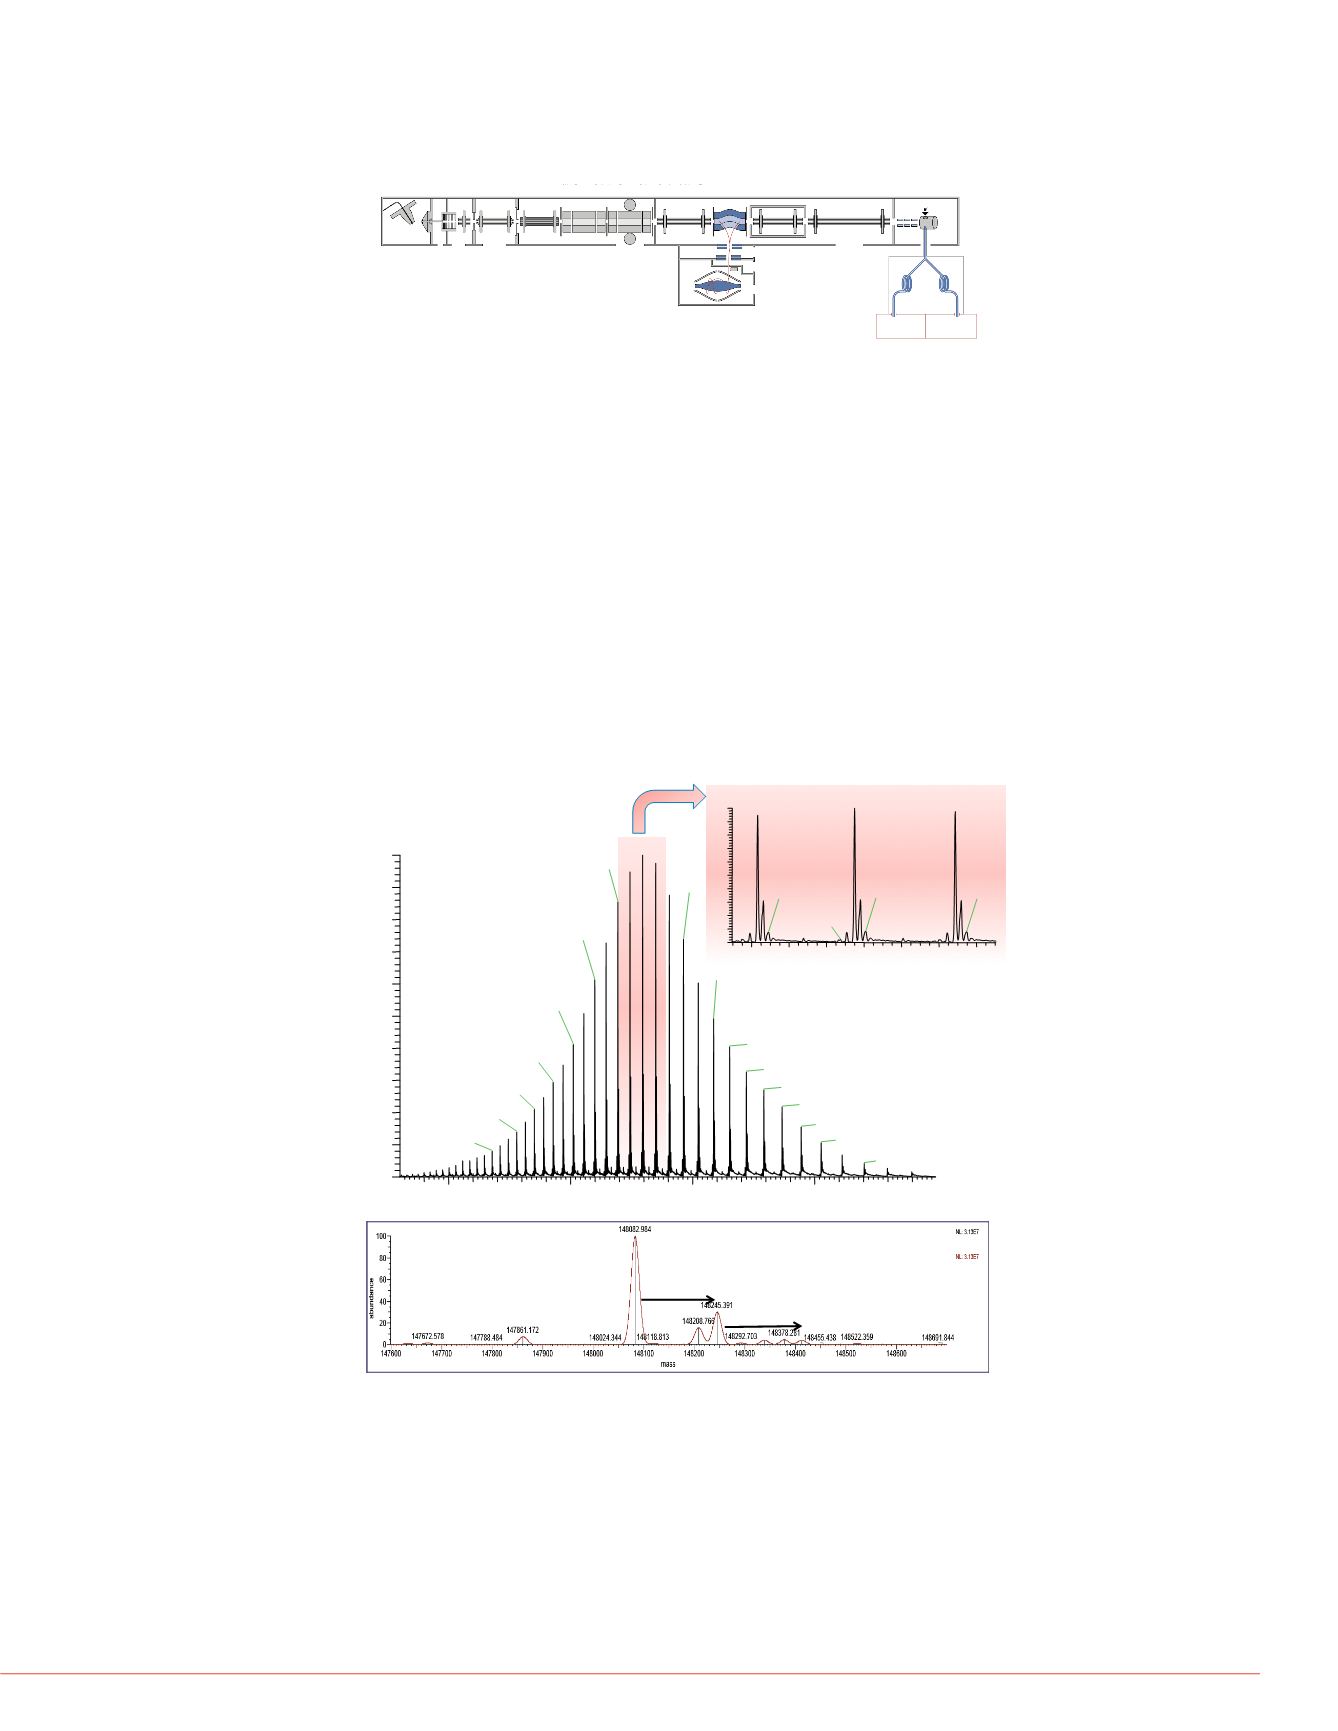
Instrument
A Thermo Scientific™ Surveyor™ MS Pump Plus was coupled to an
Orbitrap Elite mass spectrometer that was equipped with ETD (Figure 3).
Samples were purified on a Thermo Scientific™ BioBasic™ C4 column (150
x 1 mm, 5 µm particles), solvent A: 0.1 % FA, 2 % ACN in H
2
O, solvent B:
0.1 % FA in ACN. The LC gradient was 7 min 20–40 % B, 3 min 40–80 % B
at a flow rate of 100 µL/min.
Data analysis was done using Protein Deconvolution and ProSight software
packages.
Results
The analysis of large proteins of the size of intact anti-bodies (~150 kDa)
using Orbitrap mass spectrometers has been significantly improved over the
past few years. Large molecules like mAbs show only very short transient
life-times due to their relatively big cross section. Thus, the method of choice
for intact antibodies is to use the shortest transient duration (48 ms)
available on the Orbitrap Elite MS (Figure 4).
have gained significant importance in
over the past years. In order to verify
le to provide a reproducible, safe and
e correct protein sequence, as well as
of different glycoforms have to be
lyze an intact monoclonal antibody in
LC-MS using the Thermo Scientific™
he intact antibody and the separated
in Full MS experiments as well as with
e CID (SID), CID, HCD and ETD
of the ultrahigh resolution of the mass
ight software and Thermo Scientific™
on 1.0 packages were used.
gure 2) [1]: The intact antibody (144
g/µL; 5 µg HUMIRA were loaded onto
4 kDa) and heavy chain (51 kDa)
ced with DTT (20-fold molar excess,
cetamide (50-fold molar excess, room
C
H
3
C
H
2
S-‐
S-‐
Fab
Fc
Biological Characteris4cs
highlighting the attached glycans and
-chain disulfide bridges.
T:
2740
2760
2780
2800
2820
2840
2860
m/z
0
10
20
30
40
50
60
70
80
90
100
RelativeAbundance
2794.98103
2848.70886
2743.24976
2800.91032
2854.81639
2749.10120
2767.72395
2820.90307
2787.42772
2840.04424
FIGURE 4:
(A) Full MS spectrum of intact HUMIRA. The insert shows a
zoom into the three most abundant charge states z=52,53,54. (B) Spectrum
after deconvolution.
+53
+54
+52
(A)
(B)
+Hex
+Hex
(C)
(D)
23380
23390
23400
0
20
40
60
80
100
0
20
40
60
80
100
Relative Abundance
23407.
23393.62879
23407.5
23390.64710
FIGURE 5
. (A) Full MS spectrum
Zoom into +18 charge state of inta
pattern of +18 charge state. (D) I
deconvolution. (E) Monoisotopic
HUMIRA obtained after deconvoluti
(A)
(B)
z=18
z=18
z=17
z=
z=19
z=20
z=21
z=22
z=16
z=15
Δ
m=2.4 ppm
(E)
f mAbs and their biological and
cs
.
FIGURE 3:
Schematics of the Orbitrap Elite hybrid ion trap-Orbitrap mass
spectrometer equipped with an ETD source.
1300.5
1301.0
0
20
40
60
80
100
0
20
40
60
80
100
Relative Abundance
1301.2
1301.207
1301.09615
1300.98475
Electrospray source
New
High-FieldOrbitrap
MassAnalyzer
S-lens
SquareQuadrupole
withBeamBlocker
Octopole
C-trap
TransferMultipole
Reagent IonSource
Reagent1
Heated Inlet
Reagent2
Heated Inlet
HCDCollisionCell
QuadrupoleMassFilter
HighPressureCell
LowPressureCell
2000
2500
3000
3500
m/z
0
10
20
30
40
50
60
70
80
90
100
Relative Abundance
2794.98103
2693.38227
2962.591
2598.92826
3085.98807
2510.86531
3151.64648
3220.13151
2428.59194
3291.67370
3366.46848
2351.52066
3444.75592
2279.19708
3526.72930
2178.67441
3703.00780
2029.53882
800
1000
1200
1400
1600
0
10
20
30
40
50
60
70
80
90
100
Relative Abundance
1304.56287
1235.95410
1381.19873
1174.17102
1467.49915
1565.29358
1118.31189
1677.0
1067.56909
1021.25623


