4
Middle-down Analysis of Monoclonal Antibody Middle using Nano-flow Liquid Chromatography and a Novel Tribrid Orbitrap Mass Spectrometer
F1b) was surveyed by LC-MS. Data
Top Down Analysis of Prot
Middle down analysis of mA
proteolytic fragments. Precu
m/z
902.20 of the G0F glycof
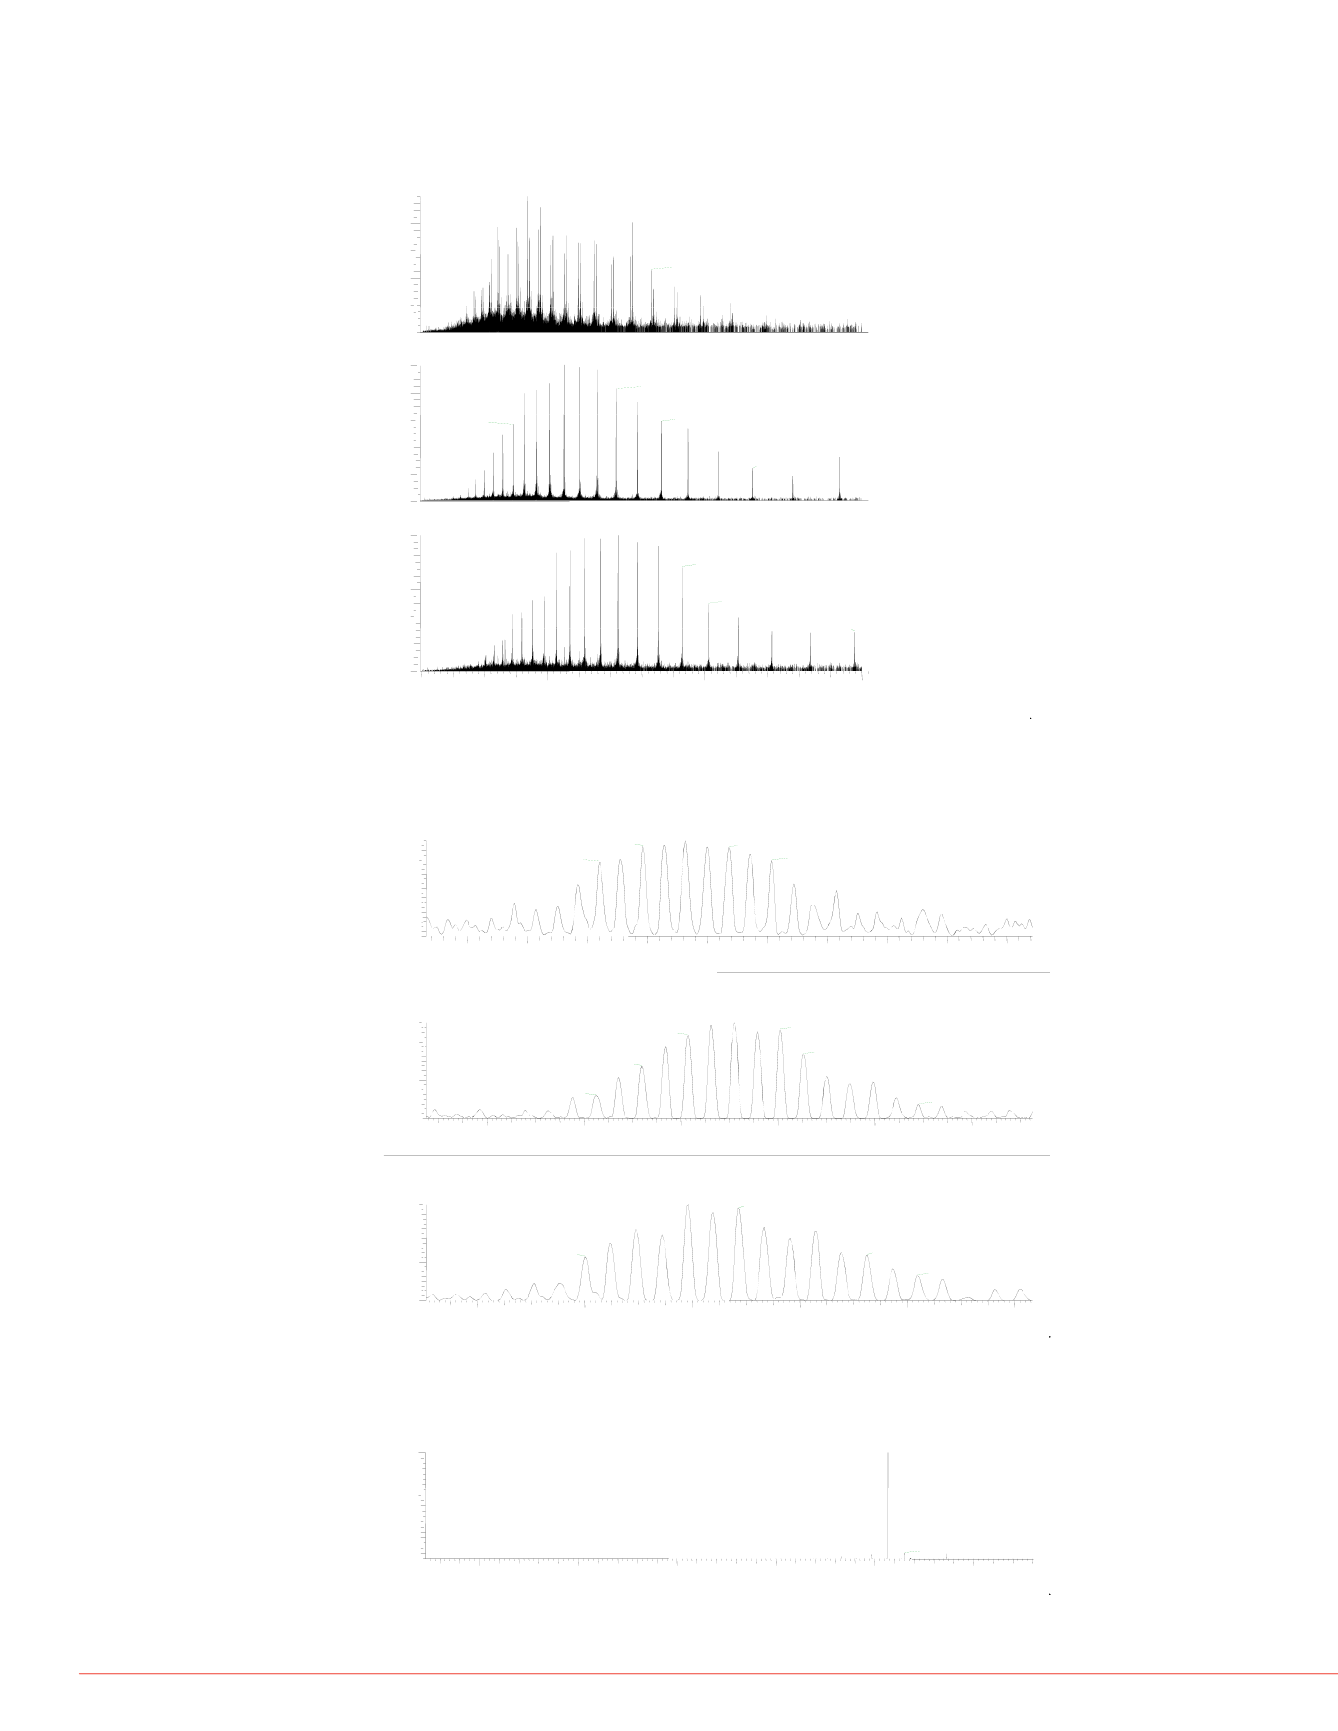
FIGURE 4. Full MS spectrum of mAb fragments at 240,000 resolution. (A) Full
MS spectrum of Fc/2; (B) Full MS spectrum of light chain; (C) Full MS spectrum
of Fd’.
100
935.7325
z=27
1270 9351
NL: 1.39E7
T: FTMS + p NSI Full
n Orbitrap Fusion MS with source
beneficial for most mAb proteins to
ner signal. The optimal SID setting is
MS/MS at 120,000 resolutio
fragmentation. The normaliz
7, tandem spectra generated
Interpretation of these ions b
ProSightPC 3.0. The combin
20
40
60
80
.
z=20
1329.0863
z=19
ms [600.00-2000.00]
(A) Fc/2
(candidate NIST RM 8670 mAb
coverage for light chain, 52
respectively (Figure 8, 10, 11
confirmed based on fragmen
spectra identified the Lys los
ETD is widely known for its a
80
100
ndance
0
1052.2509
z=22 1218.2364
z=19
1361.4397
z=17
890.4831
26
NL: 2.67E7
T: FTMS + p NSI Full
ms [600.00-2000.00]
(B) Light chain
and keeping the labile modifi
choice for locating the sites
ETD fragments between Asn
Asn61 of Fc/2 chain. In the h
accurate mass allows and is
437
294.3083
3369 2501
0
20
40
60
Relative Abu
z=
1928.2022
z=12
1652.9607
z=14
1224.2858
NL: 1.75E7
glycan-containing fragment i
Figure 7 insert is the identific
the unambiguous identificati
this c ion were observed due
were within 3 ppm mass erro
3400
3600
3800
4000
.
3447.5088
3615.6678 3805.1241 3912.0528
of the intact mAb. Different
40
60
80
100
z=21
1428.1664
z=18
1511.9984
z=17
1976.9174
z=13
T: FTMS + p NSI Full
ms [600.00-2000.00]
(C) Fd’
have played critical roles in i
FIGURE 5 Isotopically resolved mAb fragments at 240 000 resolution (A)
1000
1500
2000
m/z
0
20
FIGURE 7. ETD spectrum o
charge +28. The insert is a
charge +9 with 3ppm mass
.
,
.
Fc/2+G1F, charge +28; (B) Light Chain, charge 21; (C) Fd’, charge 21.
90
100
5
2919.3575
2923.2102 2925.8599
2932.2785
T:
FTMS + p NSI Full ms [600.00-2000.00]
100
908.0636
z=28
907.9929
z=28
908.1366
z=28 908 2076
907 9207
(A) F /2+G1F
glycan.
70
80
nce
ed mAb
Fc/2 and light chain respectively
2920
2925
2930
2935
907 7
907 8
907 9
908 0
908 1
908 2
908 3
908 4
908 5
908 6
0
20
40
60
80
Relative Abundance
.
z=28
.
z=28
908.3156
z=28
907.7781
z=28
c
40
50
60
elative Abunda
,
,
40,000 resolution on Orbitrap
y PepSwift monolithic column. For a
nt glycoforms of Fc/2 were first
.34minute. Eluted last was Fd’
.
.
.
.
.
.
.
.
.
.
m/z
T:
FTMS + p NSI Full ms [600.00-2000.00]
80
100
ndance
1102.3104
z=21 1102.4048
z=21
1102.2147
z=21
1102.4524
z=21
1102.1195
21
(B) Light chain
10
20
30
R
61
358.2070
z=1
vides base line resolution of the
nts. The isotopically resolved
es. Figure 6 shows the
is 23113.3568Da, which suggests a
ical monoisotopic mass at
1101.8
1102.0
1102.2
1102.4
1102.6
1102.8
m/z
0
20
40
60
Relative Abu
z=
1102.5968
z=21
1102.0254
z=21
1102.6899
z=21
NL:
200
400
0
MAb Fragments Eluted from a
T:
FTMS + p NSI Full ms [600.00-2000.00]
40
60
80
100
ve Abundance
1224.1915
z=21
1224.2859
z=21
1224.0952
z=21
1224.4296
z=21
1224.5247
z=21
1224.0009
z=21
1224.6193
z=21
1223.9055
(C) Fd’
2.47E10
TIC MS
frg_89
1223.8
1224.0
1224.2
1224.4
1224.6
1224.8
m/z
0
20
Relati
z=21
1223.8147
z=21
FIGURE 6. Deconvoluted monoisotopic mass of light chain.
FIGURE 8. ETD (blue) and
highlighted for addition of
24.76
Fd’
Theoretical monoisotpic mass-23113.3041Da
Mass acccuracy with external calibration-2.2ppm
T:
FTMS + p NSI Full ms [600.00-2000.00]
80
100
dance
23113.3568
24
25
26
27
22700
22800
22900
23000
23100
23200
m/z
0
20
40
60
Relative Abun
23130.3282
23096.2937


