5
Thermo Scientific Poster Note
•
PN-64145-ASMS-EN-0614S
, three of which are over 99%
mples, while N103 was detected
rth glycosylation site N184 was
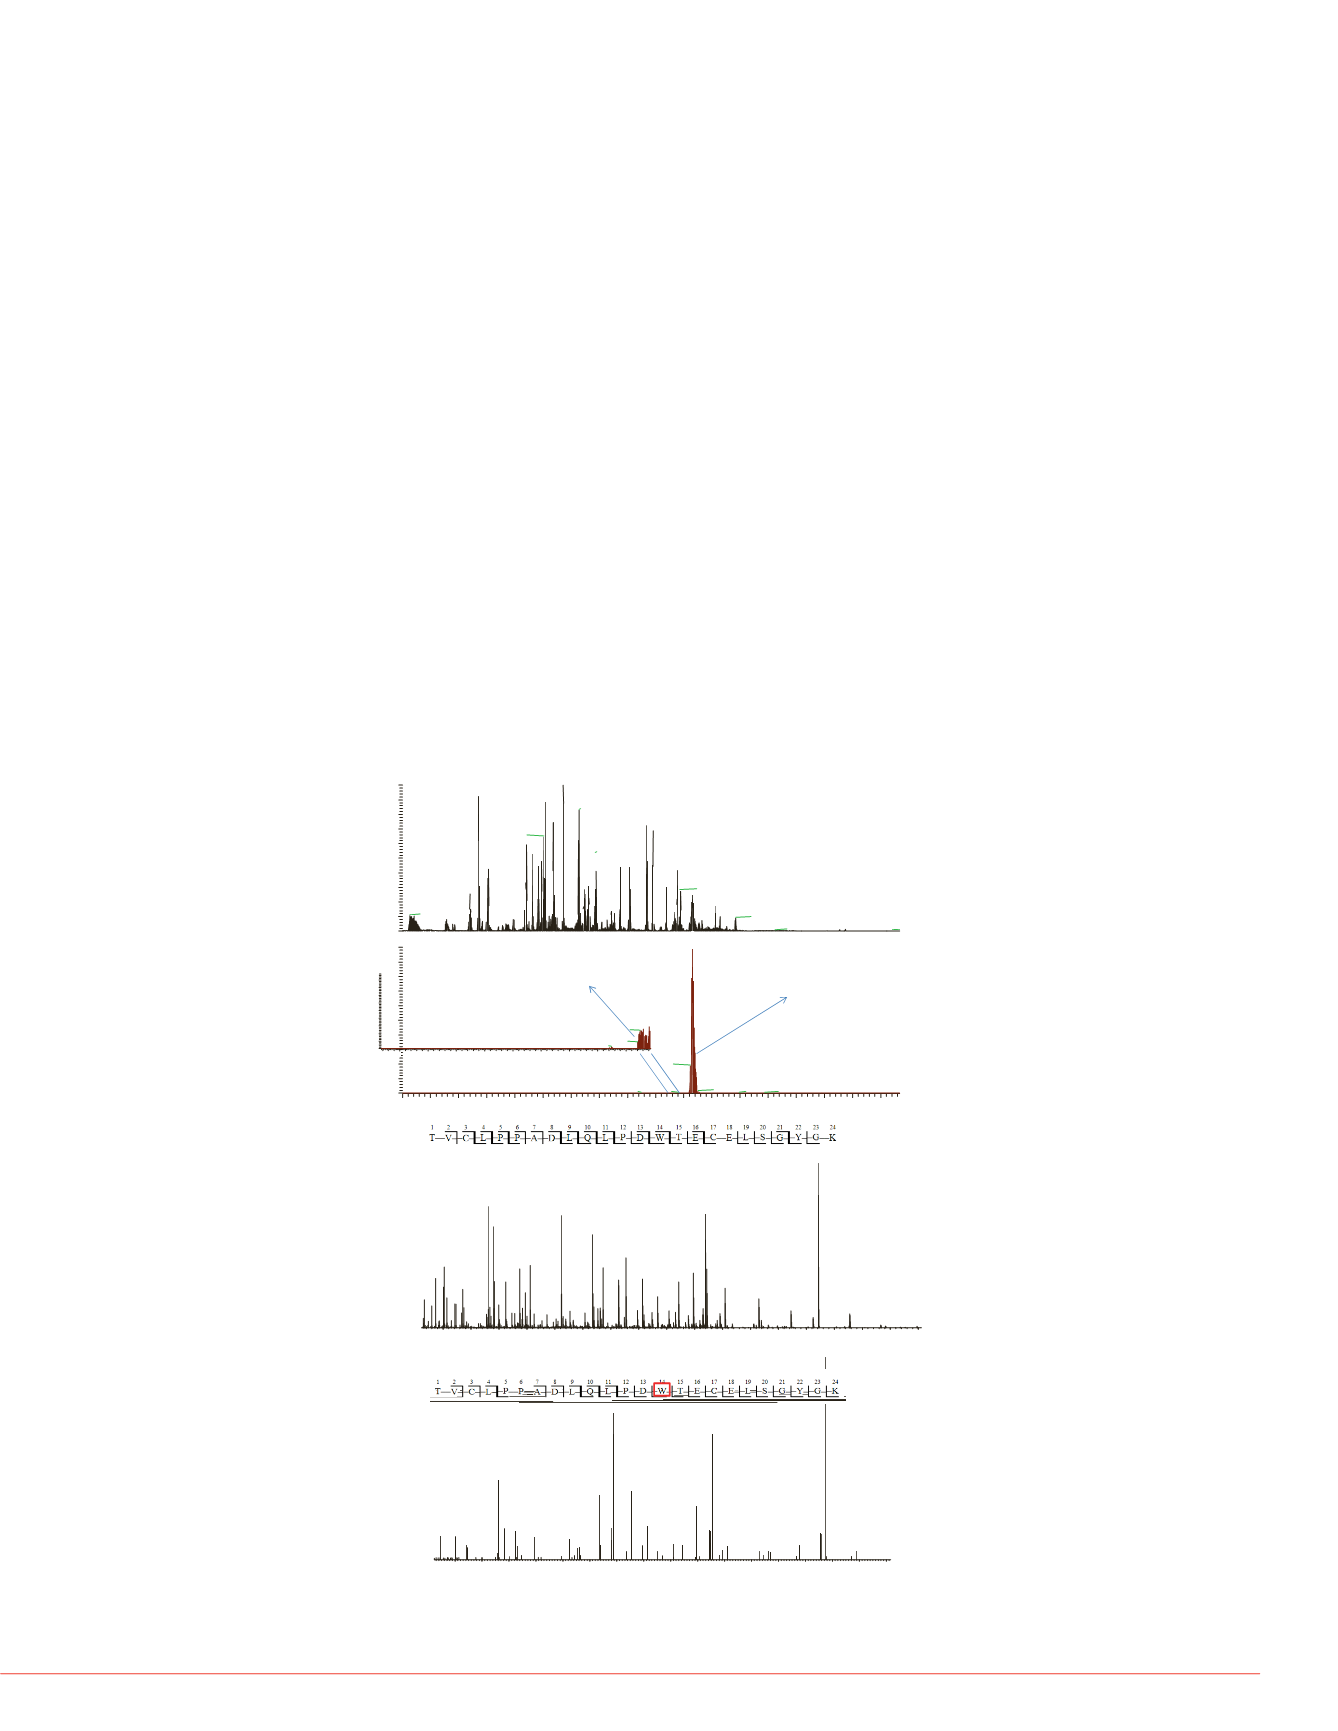
Figure 5. Identification and loc
on peptide L136-R145. High res
(top), with deamidation either o
The type and relative abundance of gllycoforms were compared across the three
samples and the following was observed:
1. The relative abundance and identity of the various glycoforms on N448 were
,
,
is glycosylated (Table 1). I-TNK
hough it shares the same amino
anufacturing process. Examples
2 and Figure 3.
consistent among all three samples (Table 2). Most of glycans on this site
contain sialic acid.
2. The identity of the glycoforms on N103 are similar between I-TNK and G-TNK,
but the relative abundance profiles are markedly different. Although the most
abundant form, A2S1G1F
,
is the same in the two samples, the second and the
460.7
y7++
ing HCDpdETD. I-TNK peptide
ment ion coverage at the top of
on from ETD (black, with glycan
can from HCD (red).
third most abundant forms are not. For the top five most abundant forms, only
two of them were common in the two samples (data not shown).
3. The glycoforms on N117 are primarily high mannose, which is very different
from the glycans identified on any of the other sites (data not shown).
4 Glycosylation on N184 was only detected for the I-TNK sample (data not
150
200
250
300
350
400
450
143.1
b2
175.1
y1
223.1
284.2
b3
325.2
335.2
y2
b4
375.2
y5++
432.2
y6++
443.2
452.2
y7-H2O++
b5
3. Other identified and quantified modifications
Besides glycosylation, other covalent modifications that were indentified in these
three samples included cysteine alkylation, deamidation, overalkyation, Cys+DTT,
.
shown), with all of the glycans containing sialic acid.
e abundance= 13.85%
150
200
250
300
350
400
450
145.1
b2
175.1
y1
335.2
y2
432.7
y6++
461.
y7+
oxidation, formylation, and glycation. Figure 4 shows confident identification and
localization of a low abundant double oxidation on W406. The relative abundance of
the oxidized form is less than 0.1%.
A total of 12 N-deamidation sites were indentified with high confidence in the three
y27[3+]
z·28[3+]
1606.0
M[3+]
150
200
250
300
350
400
450
145.1
171.1
b2
y1
228.1
284.2
b3
310.1
335.2
y2
b4
375.2
y5++
432.7
y6++
452.2
y7-H2O+
b5
461
y7+
Table 3. Identified N-deamidat
Location of N-deamidation
Fi
4 Id tifi ti
f l
b d t d bl
idi d tid T393 K416 d
samples. Deamidation on N140 was only identified in I-TNK and G-TNK, but not in
TPA. Other sites of N-deamidation were consistent across all three samples (Table 3).
Figure 5 shows examples of a peptide that were identified in 3 different forms: native
and deamidated on two different Asp residues, respectively.
1300
1400
1500
1600
1700
1800
1900
5
c·8++
c·9++
1339.0
c9++
c·10++
1374.5
c10++
c·11++
1439.1
c11++
c·24[3+]
c24[3+]
1484.0
a·25[3+]
c·25[3+]
c25[3+]
c·12++
c12++
c·26[3+]
c [ ]
a27[3+]
a·27[3+]
c·27[3+]
c27[3+]
c·13++
c13++
z27[3+]
z·27[3+]
z'27[3+]
y·27[3+]
a28[3+]
a·28[3+]
z28[3+]
c14++
1677.8
z·15
z'16c16++ c17++ c·18++ c18++
Y1-F++
N140
N142
N205
90
100
28.59
727.3284
15.25
477.1969
25.38
731.8215 31.41
918.4182
gure . en ca on o ow a un an ou e ox ze pep e -
an
localization of double oxidation to W406.
1624.2
N218
N234
N37
N370
10
20
30
40
50
60
70
80
RelativeAbundance
43.45
590.3152
25.17
546.2712
34.29
754.3414
8.81
364.2164
48.88
1014.9824
49.32
1099.4645
55.72
860.4586
1.35
368.1601
59.23
10937893
7871
0
1400
1500
1600
1700
1800
1900
.6
+
1344.1
y25++
1437.2
y26++
1522.7
1564.2
1697.3
Y1++
Y2-F++
1806.8
M1++
M2++
N454
N469
N486
50
60
70
80
90
100
0
.
.
376.2612
66.23
371.1023
89.77
371.103
51.49
917.4414
0.20
0.25
0.30
0.35
0.40
0.45
49.0
928.1
4752
TVCLPPADLQLPDWTECELSGYGK
TVCLPPADLQLPD
W
TECELSGYGK
three samples. Only those with
e of the samples are included.
old. Abbreviations for glycan
ose (Man) M
,
galactose (Gal) G,
euraminc acid (NGNA) Sg
Peak area = 1.98e+8
Peak area = 1.88e+5
Conclusion
N516
N524
0
5
10
15
20
25
30
35
40
45
50
55
60
65
70
75
80
85
Time (min)
0
10
20
30
40
51.15
917.4415
52.55
917.4409
49.09
928.1036
59.83
917.4408
85.23
917.4407
64.41
917.4404
74.20
917.4401
42.43
928.1049
6.68
928.1035
5
10
15
20
25
30
35
40
45
Time (min)
0.00
0.05
0.10
0.15
.
928.1036
47.08
928.1041
42.43
928.1049
6.68
928.1035
I-TNK
G-TNK
5.40%
3.23%
A LC-MS/MS workflow was develo
biosimilar and reference products u
software, PepFinder 1.0. This workfl
product comparison.
2.57%
<1%
<1%
1.79%
16.86%
14.43%
361.2
b3
381.2
622.3
735.4
771.3
y13++
1139.0
y20++
1541.7
y13
1.
100% sequence coverage was
2.
The identified covalent modif
alkylation, deamidation, over
glycosylation. The relative ab
between datasets. Confident id
35.34%
37.59%
1.29%
<1%
<1%
<1%
2.48%
<1%
200
300
400
500
600
700
800
900
1000
1100
1200
1300
1400
1500
1600
1700
1800
1900
m/z
133.0
173.1
b2
204.1
y2
242.2
270.1
326.2
b6-H2O++
b6++
y3
424.2
y4
b8++
446.2
y8++
474.2
b4
b9++
511.3
y5
b10++
571.3
b5
y10++b11++
y6
654.3
y11++
707.4
b13++
b7
b14++
827.9
y14++
854.4
b8
913.4
y8
b16++
947.5
y16++
967.5
b9
1008.5
1042.5
y9
y19++
1095.6
b10 y10
b21++ y21++
1208.6
b11
1329.6
y11
1444.6
y12
1654.8
y14
y15
achieved.
3.
Glycosylated peptides were cha
information of peptide sequence
glycosylation sites as well as th
are significant differences in gly
<1%
<1%
7.00%
5.04%
<1%
2.20%
1.16%
<1%
787.3
y13++
1155.0
y20++
1573.7
y13
W406 double oxidation,Relativeabundance= 0.09%
All other trademarks are the property of Ther
This information is not intended to encourag
intellectual property rights of others.
11.61%
16.50%
6.55%
2.62%
7.20%
6.51%
145.1
y1
173.1
b2
204.1
y2
242.2
270.1
361.2
b3
y3
381.2
397.2
424.2
y4
474.2
b4
b9++
494.3
511.3
y5
571.3
622.3
y6
661.2 707.4
735.4
b7y7
y14++
854.4
b8
895.4
913.4
y8
967.5
b9
1009.5
1042.5
y9
1077.5
b10-H2O
1095.6
b10
y10
1190.6
b11-H2O
1208.6
b11
1361.6
y11
1476.6
y12
1686.7
y14
y15
200
300
400
500
600
700
800
900
1000
1100
1200
1300
1400
1500
1600
1700
1800
m/z


