4
Structure Characterization and Differentiation of Biosimilar and Reference Products Using Unique Combination of Complementary Fragmentation Mechanisms
coverage
pared. Peptide mapping results indicated
The relative abundance of each modified
A total of four glycosylation sites were identified, three of which are over 99%
glycosylated. N448 was glycosylated in all three samples, while N103 was detected
in I-TNK and G-TNK and N117 only in TPA The forth glycosylation site N184 was
2. Glycosylation of TPA, I-TNK and G-TNK
The type and relative abun
samples and the following w
1. The relative abundanc
een files. A five order magnitude dynamic
chieved, which allowed identification of
ance of the unmodified versions (data not
ce coverage view for one of the data files.
.
,
,
identified only in I-TNK and only 19% of this site is glycosylated (Table 1). I-TNK
has an additional glycosylation site (N184) even though it shares the same amino
acid sequence as G-TNK, suggesting a different manufacturing process. Examples
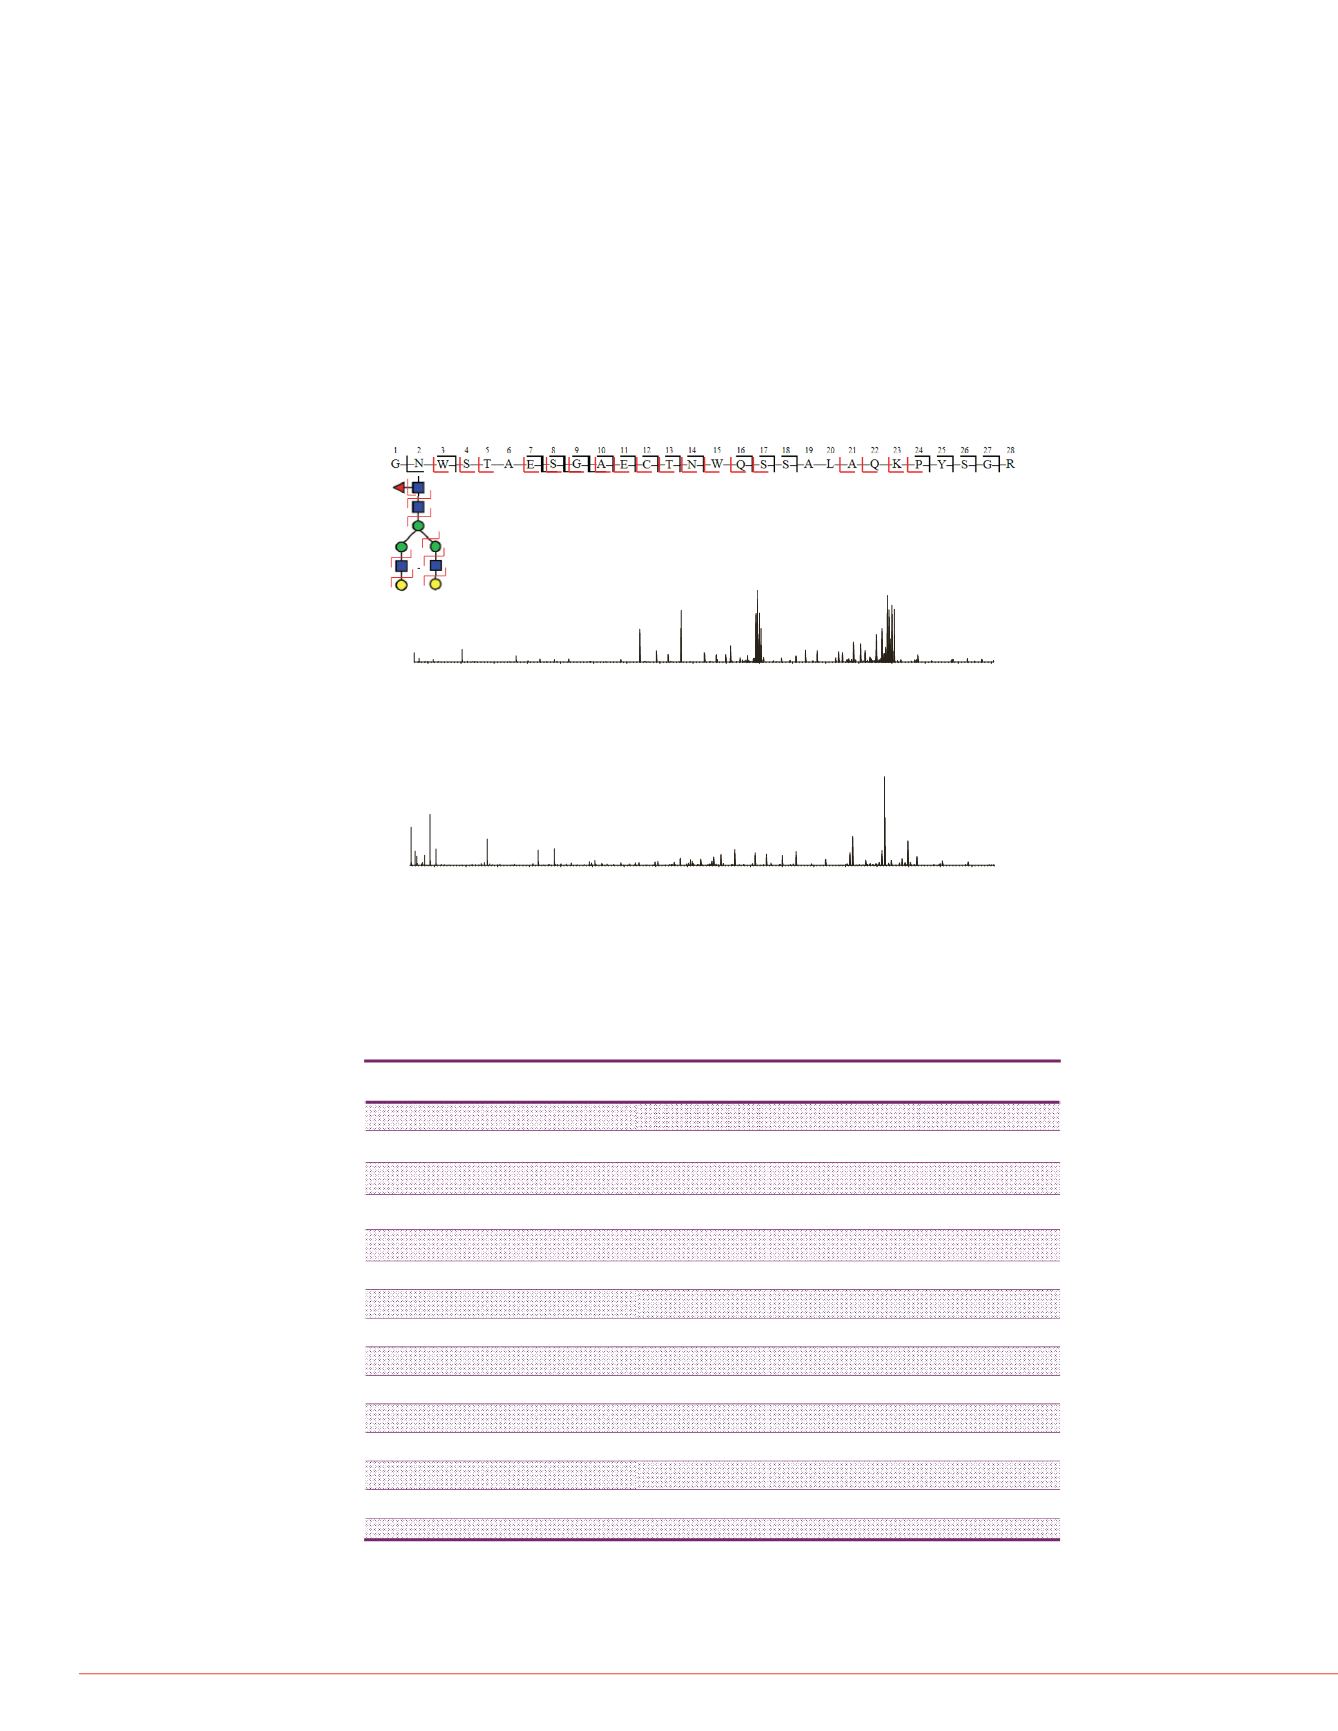
of two identified glycopeptides are shown in Figure 2 and Figure 3.
consistent among all t
contain sialic acid.
2. The identity of the glyc
but the relative abund
abundant form, A2S1G
Figure 3. Characterization of glycopeptides using HCDpdETD. I-TNK peptide
G102-R129 with glycosylation on N103. The fragment ion coverage at the top of
this figure shows peptide backbone fragmentation from ETD (black, with glycan
preserved) and fragmentation of peptide and glycan from HCD (red).
third most abundant for
two of them were com
3. The glycoforms on N1
from the glycans identifi
4 Glycosylation on N18
3. Other identified and qua
Besides glycosylation, other
three samples included cyst
.
shown), with all of the g
1204.5
M[4+]
G102 –R129, N103 glycosylation, Relative abundance= 13.85%
oxidation, formylation, and
localization of a low abunda
the oxidized form is less than
A total of 12 N-deamidation
963.6
y27[3+]
z·28[3+]
1606.0
M[3+]
ETD Spectrum
ntage of glycosylation and the
Fi
4 Id tifi ti
f l
samples. Deamidation on N
TPA. Other sites of N-deami
Figure 5 shows examples of
and deamidated on two differ
200
300
400
500
600
700
800
900
1000
1100
1200
1300
1400
1500
1600
1700
1800
1900
m/z
159.1
z·2
303.2
z·3
466.2
z·4
z·10++ z·11++ z·12++
z·14++
838.9
z·15++
z'15++
889.4
z·16++
z'16++
z·25[3+]
924.5
1034.0
z·18++
z'18++
z19++ ·19
c·3++ c3++
z20++ z·20++
z'20++
1113.2
z21++
z·21++
y·21 +
1266.5
c·7++
c7++
c·8++
c·9++
1339.0
c9++
c·10++
1374.5
c10++
c·11++
1439.1
c11++
c·24[3+]
c24[3+]
1484.0
a·25[3+]
c·25[3+]
c25[3+]
c·12++
c12++
c·26[3+]
c2 [ ]
a27[3+]
·27[ ]
c·27[3+]
c27[3+]
c·13++
c13++
z27[3+]
z·27[3+]
z'27[3+]
y·27[3+]
a28[3+]
a·28[3+]
z28[3+]
c14++
1677.8
z·15
z'16c16++ c17++ c·18++ c
138.1
204.1
(Gn)
366.1
(GGn)
Y1-F++
90
100
7
15.25
477.1969
25.38
731.82
onfidence
# glycoforms % glycosylation
18
>99
gure . en ca on o
localization of double oxid
168.1
186.1
1624.2
HCD Spectrum
10
20
30
40
50
60
70
80
RelativeAbundance
25.17
546.2712
8.81
364.2164
1.35
368.1601
11
>99
14
>99
12
19
200
300
400
500
600
700
800
900
1000
1100
1200
1300
1400
1500
1600
1700
1800
1900
m/z
(G)
528.2
(GGnM)
579.3
y5
y12++ (Bn-1)-GGnM y13++
707.4
y6
y14++ y715++ y16++
906.5
y8
y26[3+]
978.0
y17++
1009.81042.5
y18++
y19++
Y1-F[3+]
1106.5
y20++
1150.0
y21++
Y2-F[3+]
1214.6
y22++
y12
1300.6
y24++
1344.1
y25++
1437.2
y26++
1522.7
1564.2
1697.3
Y1++
Y2-F++
1806.8
M1++
M2++
50
60
70
80
90
100
0
0.20
0.25
0.30
0.35
0.40
0.45
TVCLPPADLQLPD
Table 2. Comparison of N448 glycoforms in the three samples. Only those with
relative abundance higher than 1% in at least one of the samples are included.
The five major glycoforms are highlighted in bold. Abbreviations for glycan
structure: Antenna A, core fucose (Fuc) F, mannose (Man) M
,
galactose (Gal) G,
N-acetyl neuraminic acid (NANA) S N-glycolyl neuraminc acid (NGNA) Sg
44
>99
36
>99
47
>99
Peak area = 1.8
0
5
10
15
20
25
0
10
20
30
40
6.68
928.1035
5
10
15
20
25
30
Time (min)
0.00
0.05
0.10
0.15
6.68
928.1035
using HCDpdETD. G-TNK peptide
op left is fragment ion coverage
from ETD (black, with glycan
,
N448 Glycoform
TPA
I-TNK
G-TNK
N448+A2G2F
6.41%
5.40%
3.23%
glycan from HCD (red).
N448+A2S1G0
5.18%
2.57%
<1%
N448+A2S1G0F
<1%
<1%
1.79%
N448+A2S1G1F
23.11%
16.86%
14.43%
64.1
[3+]
abundance= 0.52%
361.2
b3
381.2
N448+A2S2F
37.96%
35.34%
37.59%
N448+A3G3F
<1%
1.29%
<1%
N448+A2Sg1S1F
1.32%
<1%
<1%
N448+A3S1G2F
1.59%
2.48%
<1%
1413.1
z·6++
1450.1
c8++
1574.7
9++
1596.2
M++
ETD Spectrum
200
300
400
500
6
133.0
173.1
b2
204.1
y2
242.2
270.1
326.2
b6-H2O++
b6++
y3
424.2
y4
b8++
446.2
y8++
474.2
b4
b9++
511.3
y5
b10++
571.3
b5
y10++b
N448+A3S2G0
1.43%
<1%
<1%
N448+A3S2G1F
5.19%
7.00%
5.04%
N448+A4S2G2F
<1%
<1%
2.20%
N448+A4S1G3F
<1%
1.16%
<1%
1100
1200
1300
1400
1500
1600
+]
3+]
[3+]
1214.0
1267.5
z4++
z·4++
z5++ z·5++
z'5++y5+
z6++
z'6++
y·6++ y
z7++
z·7++
z'7++y7++a·8++
z8++
z·8++
b·8++
c·8++
a·9++
z9++
z·
HCD Spectrum
W406 dou
N448+A3S3F
9.33%
11.61%
16.50%
N448+A4S3G1F
1.17%
6.55%
2.62%
N448+A4S4F
1.67%
7.20%
6.51%
1200
1300
1400
1500
1600
1700
1800
86.0
nM++
1G1++
1267.0
-SGGn++
A2G1++
1331.6
-GGnM++
-G-F++
1477.7
Y1
1534.7
Y2-F
Y2
1696.8
M1
M1F
1858.8
M2
145.1
y1
173.1
b2
204.1
y2
242.2
270.1
361.2
b3
y3
381.2
397.2
424.2
y4
474.2
b4
b9++
494.3
511.3
y5
57
200
300
400
500


