3
Thermo Scientific Poster Note
•
PN-64145-ASMS-EN-0614S
R lt
iosimilar and reference products
hod that utilizes two different
ence and PTM identification and
esu s
1. Peptide identification and protein sequence coverage
The data was analyzed and the results were compared. Peptide mapping results indicated
100% sequence coverage for all of the data files The relative abundance of each modified
A total of four glycosylation sit
glycosylated. N448 was glycosyl
in I-TNK and G-TNK and N117 o
2. Glycosylation of TPA, I-TNK
n
TM
Tribrid
TM
mass spectrometer.
data-dependent experiment, the
diagnostic ions from glycan
triggered on the same peptide to
f glycosylation The new Thermo
.
peptide forms was calculated and compared between files. A five order magnitude dynamic
range for identified peptide abundance was achieved, which allowed identification of
modified peptides with less than 0.01% in abundance of the unmodified versions (data not
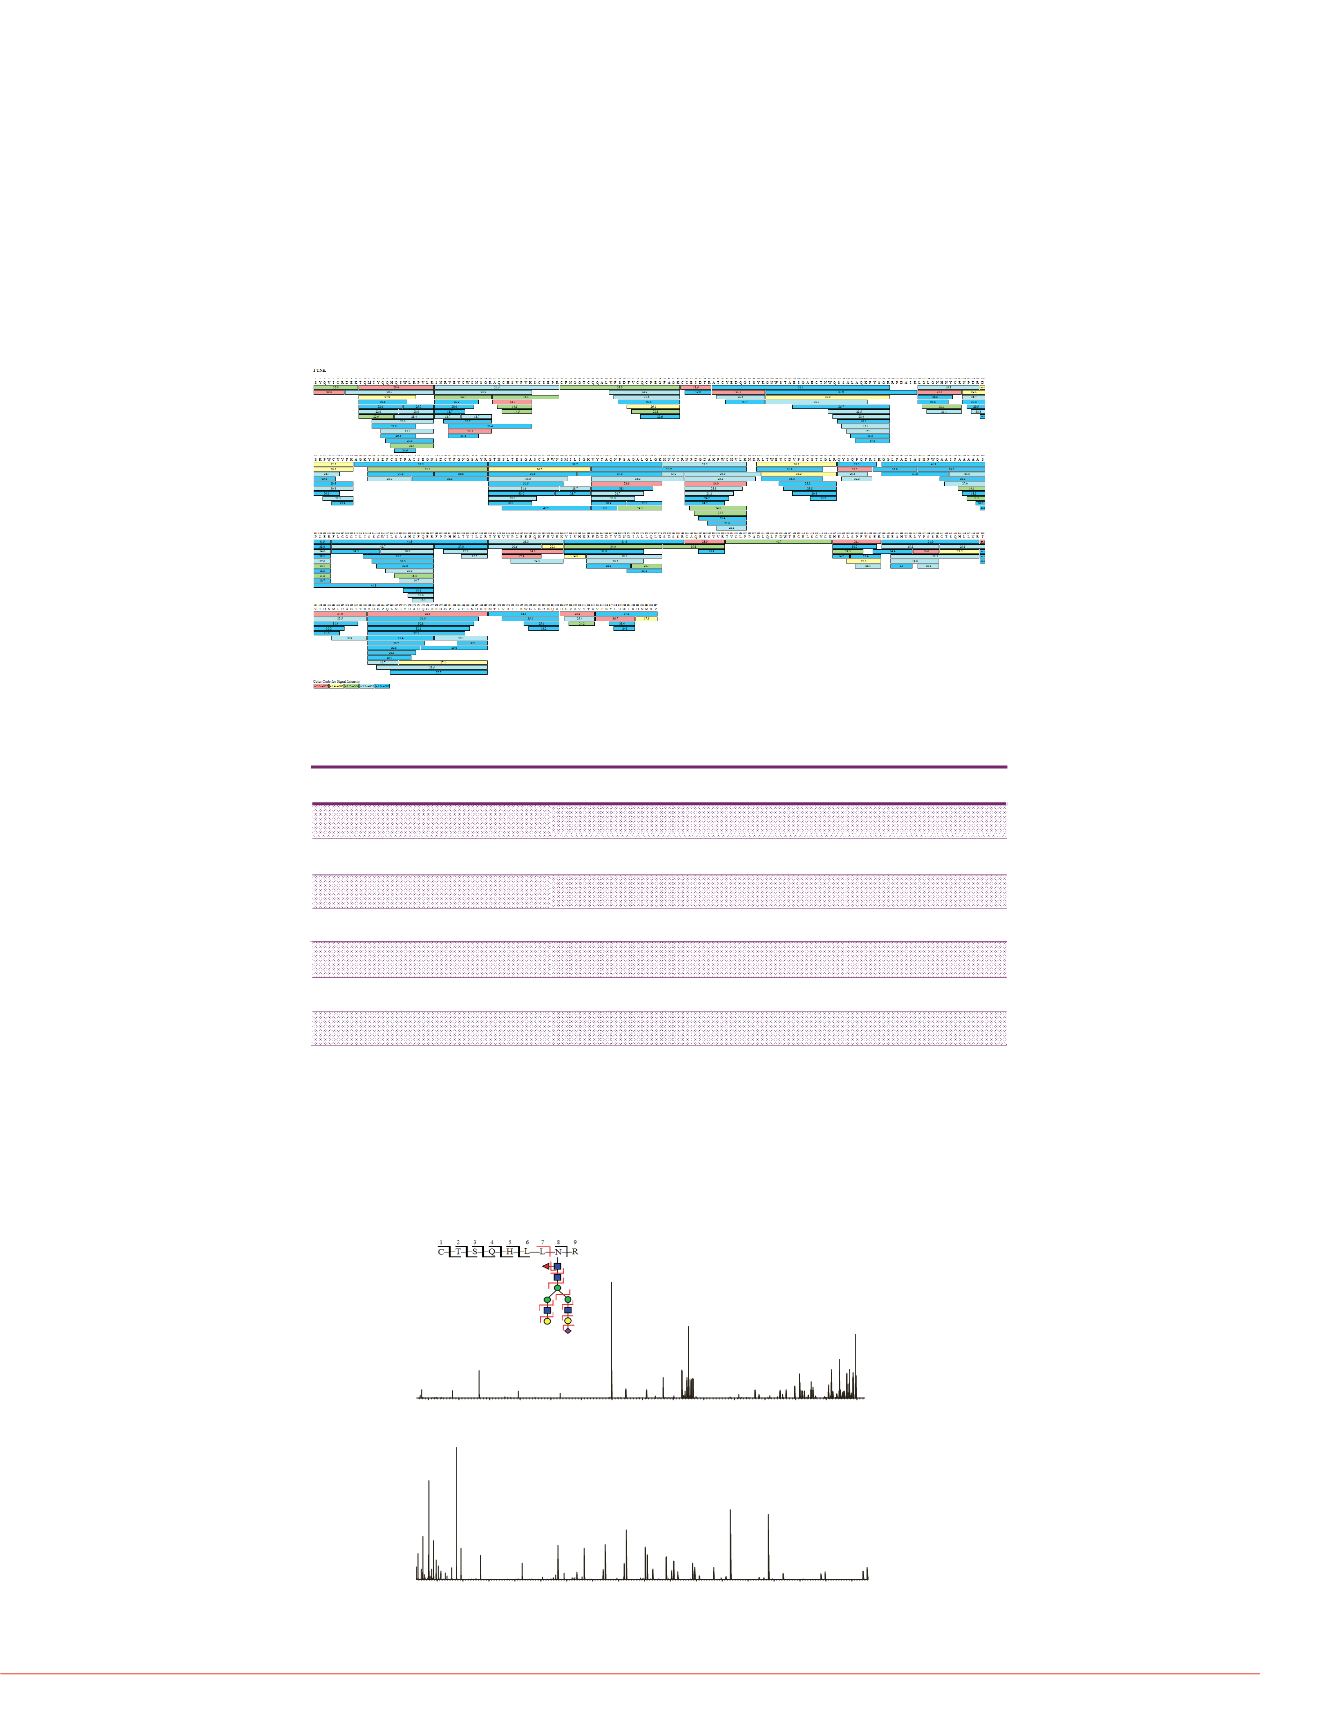
shown). Figure 1 shows an example of the sequence coverage view for one of the data files.
identified only in I-TNK and only
has an additional glycosylation s
acid sequence as G-TNK, sugge
of two identified glycopeptides ar
.
was used for data analysis.
ntiating minor difference of protein
Orbitrap Fusion LC-MS/MS and
nt, confident and comprehensive
l
f l t t l t
i
f
Figure 1. 100% sequence coverage of I-TNK
Figure 3. Characterization of
G102-R129 with glycosylation o
this figure shows peptide backb
preserved) and fragmentation of
so or o - o- o compar son o a
i l
d
d f
G102 –R129, N103 glyc
maceut ca pro ucts create a ter
pproval of a biosimilar product by
t demonstrates comparability with
h resolution mass spectrometry
erties including primary structure,
s) and low abundant sequence
ETD Spectrum
,
t approach for comparability study
products including glycosylation
LC/MS/MS with complementary
re package.
Table 1 Identified glycosylation sites percentage of glycosylation and the
200
300
400
500
600
700
800
159.1
z·2
303.2
z·3
466.2
z·4
z·10++ z·11++ z·12++
z·14++
838.9
z·15++
z'15++
138.1
204.1
(Gn)
366.1
(GGn)
product, TPA, I-TNK and G-TNK,
.
,
number of glycoforms identified with high confidence
Site of glycosylation
Sample
# glycoforms % glycosylation
N 103
I-TNK
18
>99
168.1
186.1
HCD Spectrum
ation. Tenectelplase (TNK) is a
es:
N 103
G-TNK
11
>99
N117
TPA
14
>99
N 184
I-TNK
12
19
200
300
400
500
600
700
800
(G)
528.2
(GGnM)
579.3
y5
y12++ (Bn-1)-GGnM y13++
707.4
y6
y14++ y715++
ific
TM
EasySpray
TM
source setup
high-pressure easy nanoLC (U-
olvent A) and 0.1% formic acid in
min gradient was used to elute
Table 2. Comparison of N448 gl
relative abundance higher than
The five major glycoforms are
structure: Antenna A, core fuco
N-acetyl neuraminic acid (NANA
N 448
TPA
44
>99
N 448
I-TNK
36
>99
N 448
G-TNK
47
>99
meter with a Thermo Scientific
TM
ed for glycopeptide analysis was
Figure 2. Characterization of glycopeptides using HCDpdETD. G-TNK peptide
C441-R449 with glycosylation on N448. Top left is fragment ion coverage
showing peptide backbone fragmentation from ETD (black, with glycan
N448 Glycoform
N448+A2G2F
MS/MS spectra on peptides in a
ic sugar oxonium ions from glycan
a subsequent ETD fragmentation
e amino acid backbone sequence
, for each glycopeptide, this HCD
i
f HCD d ETD t
preserved) and fragmentation of peptide and glycan from HCD (red).
N448+A2S1G0
N448+A2S1G0F
N448+A2S1G1F
1064.1
M[3+]
C441-R449 , N448 glycosylation, Relativeabundance= 0.52%
a pa r o
an
spec ra,
site of glycosylation as well as
cquired at 120,000 resolution (at
ere acquired at 30,000 resolution
rature was set to 275 °C and the
ction for data dependent MS/MS
N448+A2S2F
N448+A3G3F
N448+A2Sg1S1F
N448+A3S1G2F
366.1
c3
798.3
M[4+]
966.7
1413.1
z·6++
1450.1
c8++
1574.7
9++
1596.2
M++
ETD Spectrum
-
/z
. HCD collision energy was 30
the standard calibration.
is software provides automated
N448+A3S2G0
N448+A3S2G1F
N448+A4S2G2F
N448+A4S1G3F
200
300
400
500
600
700
800
900
1000
1100
1200
1300
1400
1500
1600
m/z
178.1
c1
279.1
c2
494.2
c4
631.3
c5
845.0
913.1
z6[3+]
a·9[3+]
z9[3+]
z·9[3+]
1214.0
1267.5
z4++
z·4++
z5++ z·5++
z'5++y5+
z6++
z'6++
y·6++ y
z7++
z·7++
z'7++y7++a·8++
z8++
z·8++
b·8++
c·8++
a·9++
z9++
z·
138.1
204.1
(Gn)
(Gn)
274.1
366.1
(GGn)
HCD Spectrum
ectrometry data for large-scale
odifications. Peptide identification
tion spectrum to the predicted
of related peptide ions under their
antification of modified peptides A
N448+A3S3F
N448+A4S3G1F
N448+A4S4F
200
300
400
500
600
700
800
900
1000
1100
1200
1300
1400
1500
1600
1700
1800
168.1
186.1
292.1
(S)
528.2
(GGnM)
(SGGn)
666.3
Y1-F++
(Bn-1)-SGGnMY1++
767.9
Y2-F++
b7
Y2++
848.9
M1++
M1F++
929.9
M2++
1002.9
M2F++
M3++
A1G0M2++
1084.5
M3F++
A1G0M2F++
A1G1M2++
1186.0
-SGGnM++
A1G1++
1267.0
-SGGn++
A2G1++
1331.6
-GGnM++
-G-F++
1477.7
Y1
1534.7
Y2-F
Y2
1696.8
M1
M1F
1858.8
M2
.
ntification.
m/z


