3
Thermo Scientific Poster Note
•
PN-64147-ASMS-EN-0614S
ng middle-down approach on a
ass spectrometer
Results
Full Mass Spectrum of Intact mAb
Intact mAb (candidate NIST RM 8670 mAb lot #3F1b) was surveyed by LC-MS. Data
FIGURE 4. Full MS spectrum of m
MS spectrum of Fc/2; (B) Full MS
of Fd’.
100
935.7325
z=27
1270 93
tography and complementary
n transfer dissociation (ETD)
r was developed and
chemically cleaved into Fd’
shown below was acquired at 15,000 resolution on Orbitrap Fusion MS with source
CID at 70. The application of 40-80 source CID is beneficial for most mAb proteins to
help remove the adducts and thus promote a cleaner signal. The optimal SID setting is
protein dependent.
20
40
60
80
.
z=20
1
,
onoclonal antibody and its
gments (Fd’, Fc/2 and light
n average 50% amino acid
biguously identified
FIGURE 1. Full MS spectrum of the intact mAb (candidate NIST RM 8670 mAb
lot #3F1b) obtained from LC-MS analysis.
T:
FTMS + p ESI sid=70.00 Full ms [1000.00-6000.00]
90
100
2965.0037
2906.8879
3025 5167
80
100
ndance
0
1052.2509
z=22 1218.2
z=1
1
890.4831
26
rtant line of therapeutics for the
30
40
50
60
70
80
RelativeAbundance
.
2851.0285
2797.2627
3154.1717
2695.5589
3222.7437
3294.3083
2647.4794
3369 2501
2601 0195
0
20
40
60
Relative Abu
z=
1224.285
stand the biochemical and
cent developments in high
ation techniques have clearly
proteins and in particular its
in middle-down approach
f
2400
2600
2800
3000
3200
3400
3600
3800
4000
m/z
0
10
20
.
.
2558.9576
3447.5088
2430.4122
3615.6678 3805.1241 3912.0528
FIGURE 2. Expanded view of full MS spectrum of the intact mAb. Different
glycoforms at charge +51 was shown
40
60
80
100
z=21
l eatures. Here, we describe
tion with nano liquid
sing different dissociation
FIGURE 5 Isotopically resolved m
T:
FTMS + p ESI sid=70.00 Full ms [1000.00-6000.00]
70
80
90
100
nce
2906.8879
2910.1479
.
1000
m/
0
20
th hi
i
i t
.
Fc/2+G1F, charge +28; (B) Light C
0
10
20
30
40
50
60
RelativeAbunda
2903.7472
2913.3612
2916.4695
2919.3575
2923.2102
2899.8132
2925.8599
2932.2785
2895.7333
T:
FTMS + p NSI Full ms [600.00-2000.00]
100
907.992
z=28
907 9207
e nge reg on n o a
date NIST RM 8670 mAb lot
en) at 37
o
C for 1 hour. The
ed and reduced in 50mM
ur. The proteolytically
rmic acid in water
Intact LC-MS Analysis of Proteolytic Fragmented mAb
A mixture including approximately 20 pmol of Fd’ Fc/2 and light chain respectively
2895
2900
2905
2910
2915
2920
2925
2930
2935
m/z
907 7
907 8
907 9
90
0
20
40
60
80
Relative Abundance
.
z=28
907.7781
z=28
.
aphically eluted from a Thermo
olumn (200 µm x 25 cm,
One µL of the stock was
,
,
,
was eluted at 800 nl/min and directly analyzed at 240,000 resolution on Orbitrap
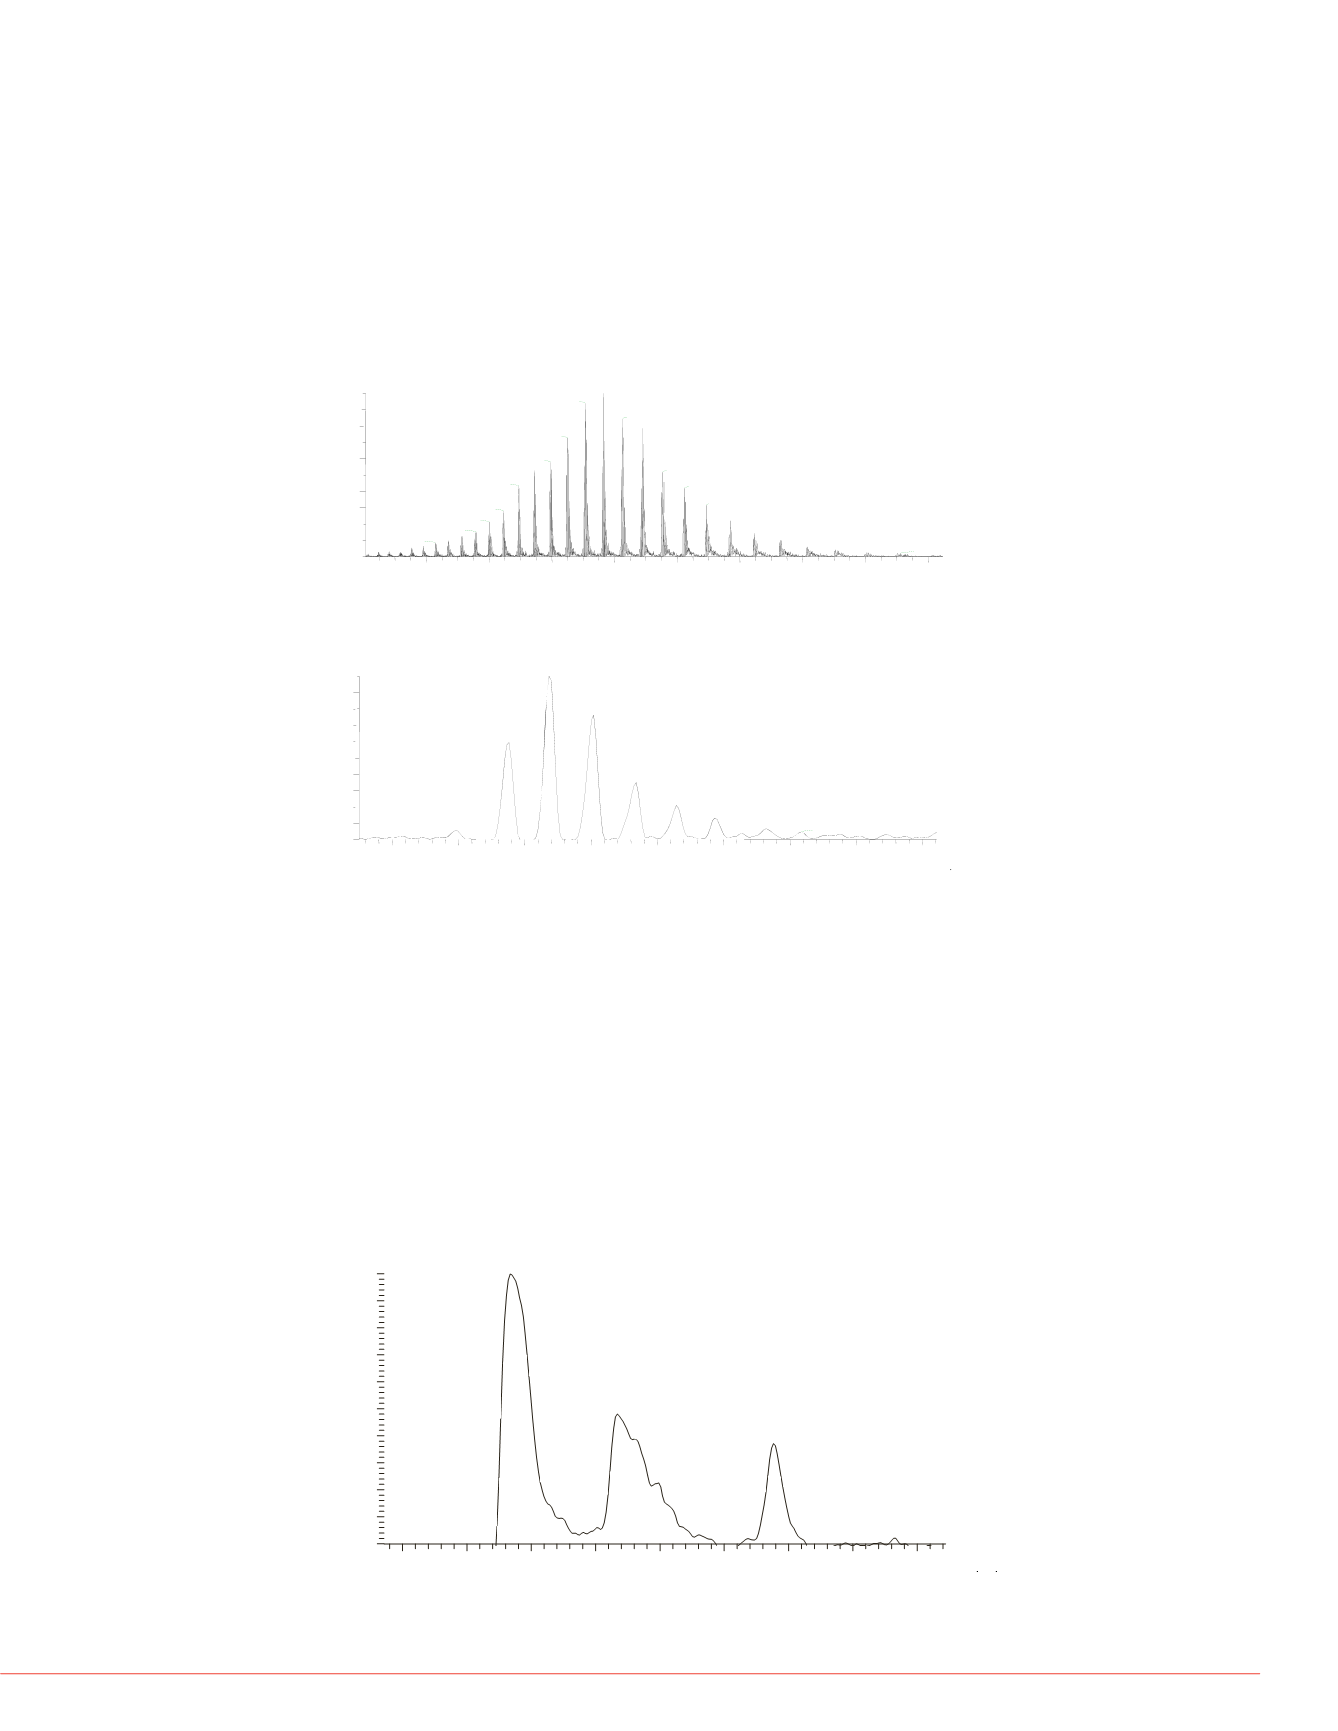
Fusion MS. The mAb fragments were separated by PepSwift monolithic column. For a
800 nl/min gradient of 5-60% in 32 minutes, different glycoforms of Fc/2 were first
eluted at 20.67minute, followed by light chain at 22.34minute. Eluted last was Fd’
chain at 24.76min.
.
.
.
T:
FTMS + p NSI Full ms [600.00-2000.00]
80
100
ndance
1102.11
21
graphy was performed with a
Thermo Scientific™ EASY-
by a standard Orbitrap fusion
d include the aqueous as
ew Jersey) and the organic as
Full MS spectra acquired at 240,000 resolution provides base line resolution of the
isotope distribution of the ~25,000Da mAb fragments. The isotopically resolved
spectra were deconvoluted for monoisotopic masses. Figure 6 shows the
deconvoluted monoisotopic mass of the light chain is 23113.3568Da, which suggests a
mass accuracy of 2 2ppm comparing to its theoretical monoisotopic mass at
1101.8
1102.0
0
20
40
60
Relative Abu
z=
1102.0254
z=21
RT:
18.71 - 27.44
SM:
7G
20 67
NL:
ey) in acetronitirile (Fisher
ed by a standard Orbitrap
.
23113.3041Da.
FIGURE 3. Total Ion Current Chromatogram of MAb Fragments Eluted from a
PepSwift Monolithic Nano Column.
Fc/2
T:
FTMS + p NSI Full ms [600.00-2000.00]
40
60
80
100
ve Abundance
1224.09
z=21
1224.0009
z=21
1223.9055
70
80
90
100
nce
.
2.47E10
TIC MS
frg_89
mode using higher-energy
ciation (ETD). Full mass
olution at
m/z
200 with mass
as at 1e5 with 100ms
t at 300
o
C. Full mass spectra
Li ht Ch i
1223.8
1224.0
0
20
Relati
z=21
1223.8147
z=21
FIGURE 6. Deconvoluted monois
30
40
50
60
Relative Abunda
22.34
22.60
24.76
200 with mass range
m/z
tific
TM
Protein Deconvolution
TM
d
t
f Fd’ F /2
g a n
Fd’
Theoretical monoisotpic
Mass acccuracy with exte
T:
FTMS + p NSI Full ms [600.00-2000.00]
80
100
dance
19
20
21
22
23
24
25
26
27
Time (min)
0
10
20
em mass spec ra o
, c
voluted spectra were
data interpretation.
22700
22800
0
20
40
60
Relative Abun


