5
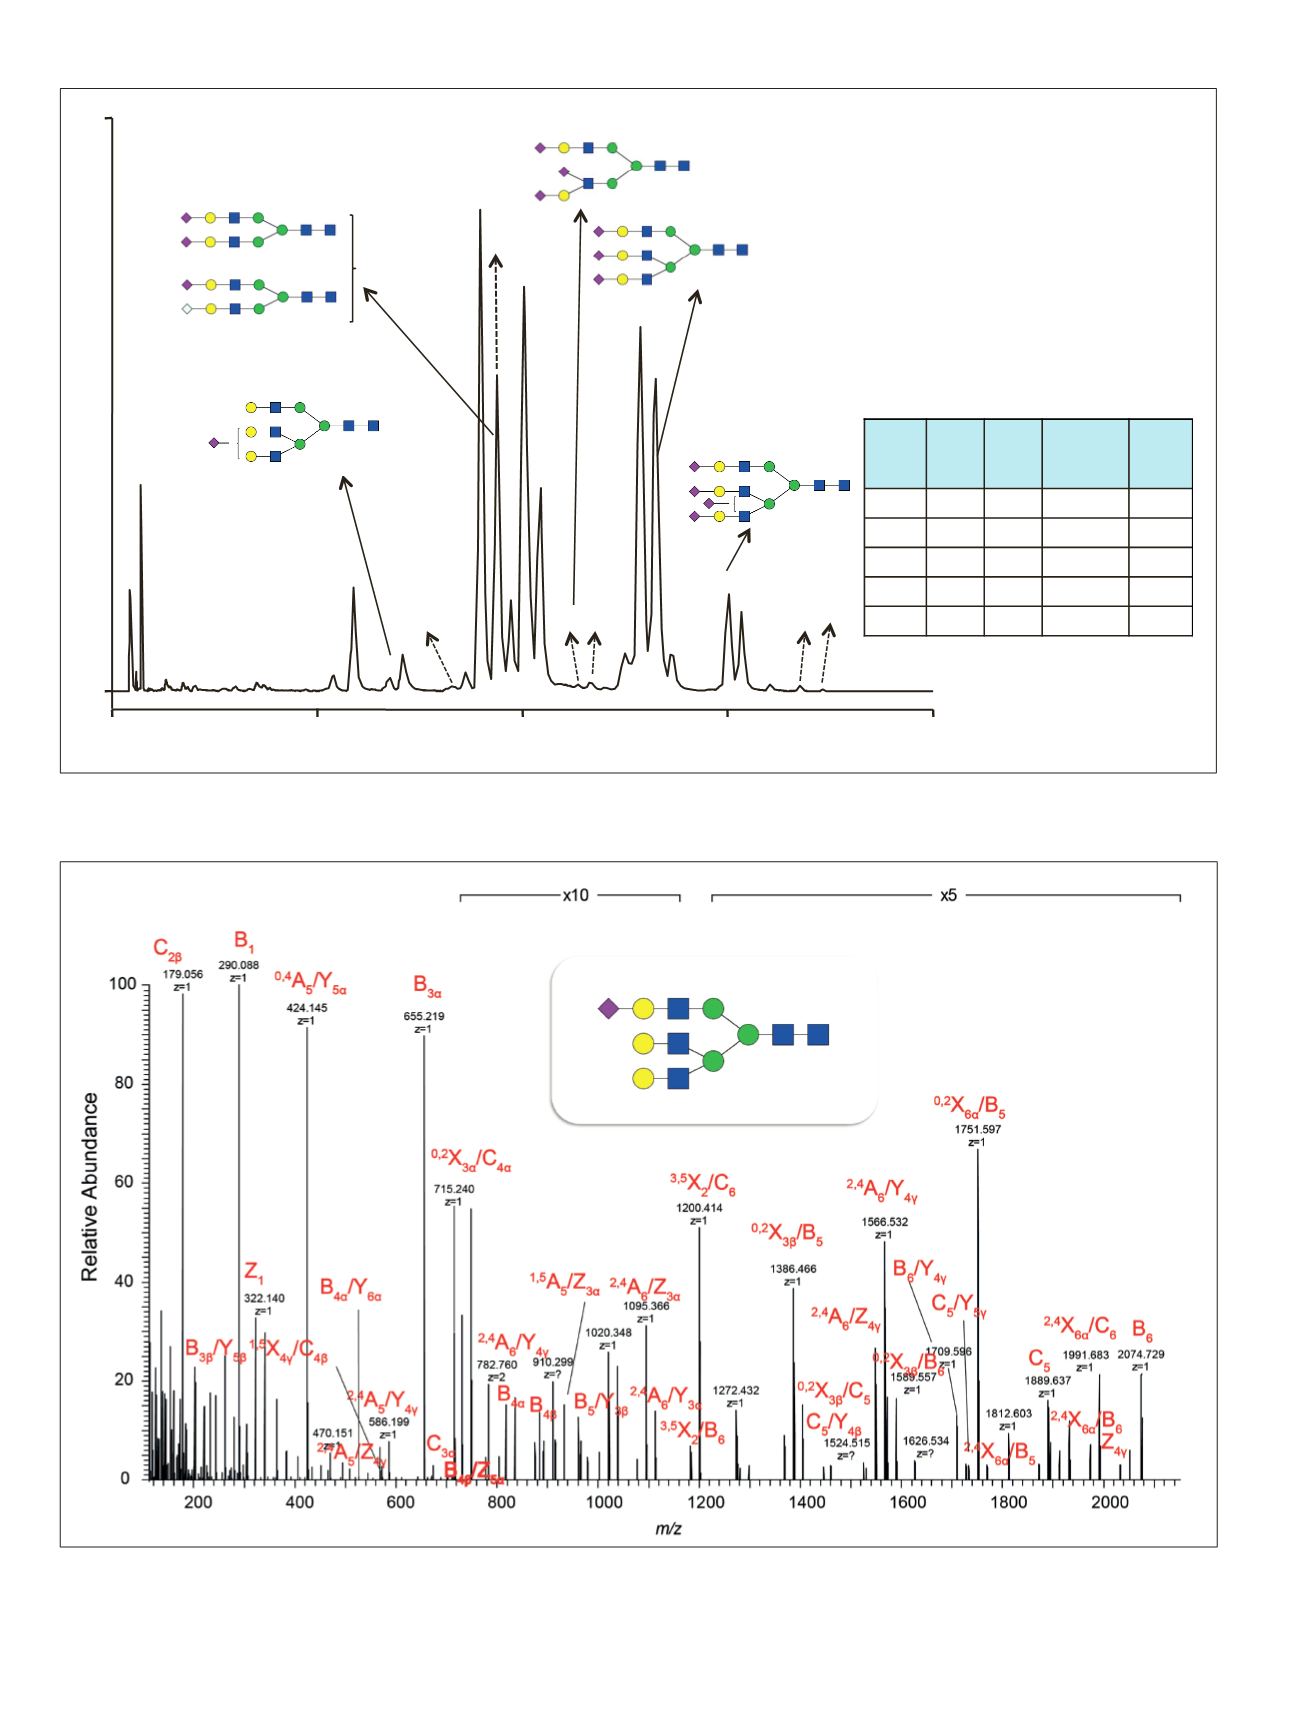
Figure 2. HCD MS/MS spectrum of a 2AB-labeled monosialylated triantennary
N
-glycan from bovine fetuin
Figure 1. LC-MS analysis of 2AB labeled
N
-glycans from bovine fetuin by GlycanPac AXH-1 column with MS detection
Column:
GlycanPac AXH-1 (1.9 µm)
Dimension:
2.1 x 150 mm
Mobile phase: A: Acetonitrile/water (80:20, v/v)
B: Ammonium formate (80mM, pH 4.4)
Flow:
0.4 mL/min
Temp:
30
o
C
Injection:
50 pmol
Detection:
MS detector
Sample:
2AB labeled N-glycan from bovine fetuin
MS mode:
Negative
FT-MS range: m/z = 380–2000
0
10
20
30
40
Minutes
0
100
1
3
4
6 5
9
10a-c
11a-b
15
13
14
12
18
19
20
17
22
23
24
21
2
7
8
16
25
Relative Abundance
Time
(min)
% A
% B
Flow
Rate
(mL/min)
Curve
-10
97.5
2.5
0.4
5
0
97.5
2.5
0.4
5
30
87.5
12.5
0.4
5
35
75.0
25.0
0.4
5
40
62.5
37.5
0.4
5
11a
11b
6
15
19
21


