
Application
Note: 505
Key Words
Quantitative Analysis of Mevalonate in Plasma
Using LC-MS/MS
Flavio Giavarini
1
, Omar Maschi
1
, Samuele Scurati
2
, Donatella Caruso
1
1
Department of Pharmacological Sciences, Università degli Studi di Milano, Milano, Italy;
2
Thermo Fisher Scientific, Rodano, Italy
For Research Use Only. Not for use in diagnostic procedures.
Introduction
Cholesterol is synthesized
in vivo
through a multiple step
pathway. Because mevalonate is the key intermediate of
this process, its plasmatic levels are an indirect measure
of
in vivo
cholesterol synthesis and, therefore, facilitate
clinical research into pharmacological activity of anti-
hypercholesterolemic drugs such as statins.
Goal
To develop a reliable and fast analytical method for the
quantitative determination of mevalonate in plasma using
a Thermo Scientific LTQ linear ion trap mass spectrometer.
Experimental
Sample Preparation
The plasma sample (500 µL) was spiked with 20 ng of
Mevalonate-D
7
. Samples were acidified with hydrochloric
acid allowing the conversion of mevalonate to mevalono-
lactone (Figure 1). After purification through solid phase
extraction (SPE), samples were dried and dissolved in 400
µL of 0.2% ammonium hydroxide to restore the non-
lactonic form. Then 10 µL were injected.
Quantitative analysis was performed on the basis of
calibration curves, ranging from 2.5 to 250 ng/mL.
High performance liquid chromatography (HPLC)
analysis was performed using a Thermo Scientific Surveyor
autosampler and pump. The 10 µL sample was injected
directly on a Thermo Scientific BioBasic AX column
(150 × 2.1 mm, 5 µm). A gradient LC method used mobile
phases A (10 mM ammonium formate, pH 8) and B
(acetonitrile) at a flow rate of 200 µL/min.
Mass Spectrometry
MS analysis was carried out on a LTQ
™
linear ion trap
mass spectrometer equipped with a Thermo Scientific Ion
Max source with an electrospray ionization (ESI) probe.
Ion polarity:
Negative
Spray voltage:
2 kV
Sheath/Auxiliary gas:
Nitrogen
Sheath gas pressure:
40 (arbitrary units)
Auxiliary gas pressure:
10 (arbitrary units)
Sweep gas pressure:
5 (arbitrary units)
Ion transfer tube temperature:
300 °C
Scan type:
Full Scan MS/MS
Collision gas:
Helium
Collision energy:
30%
Divert valve:
3.0-6.5 min to source
Selected ions for quantification:
m/z
147 59 for mevalonate
m/z
154 59 for mevalonate-D
7
Results and Discussion
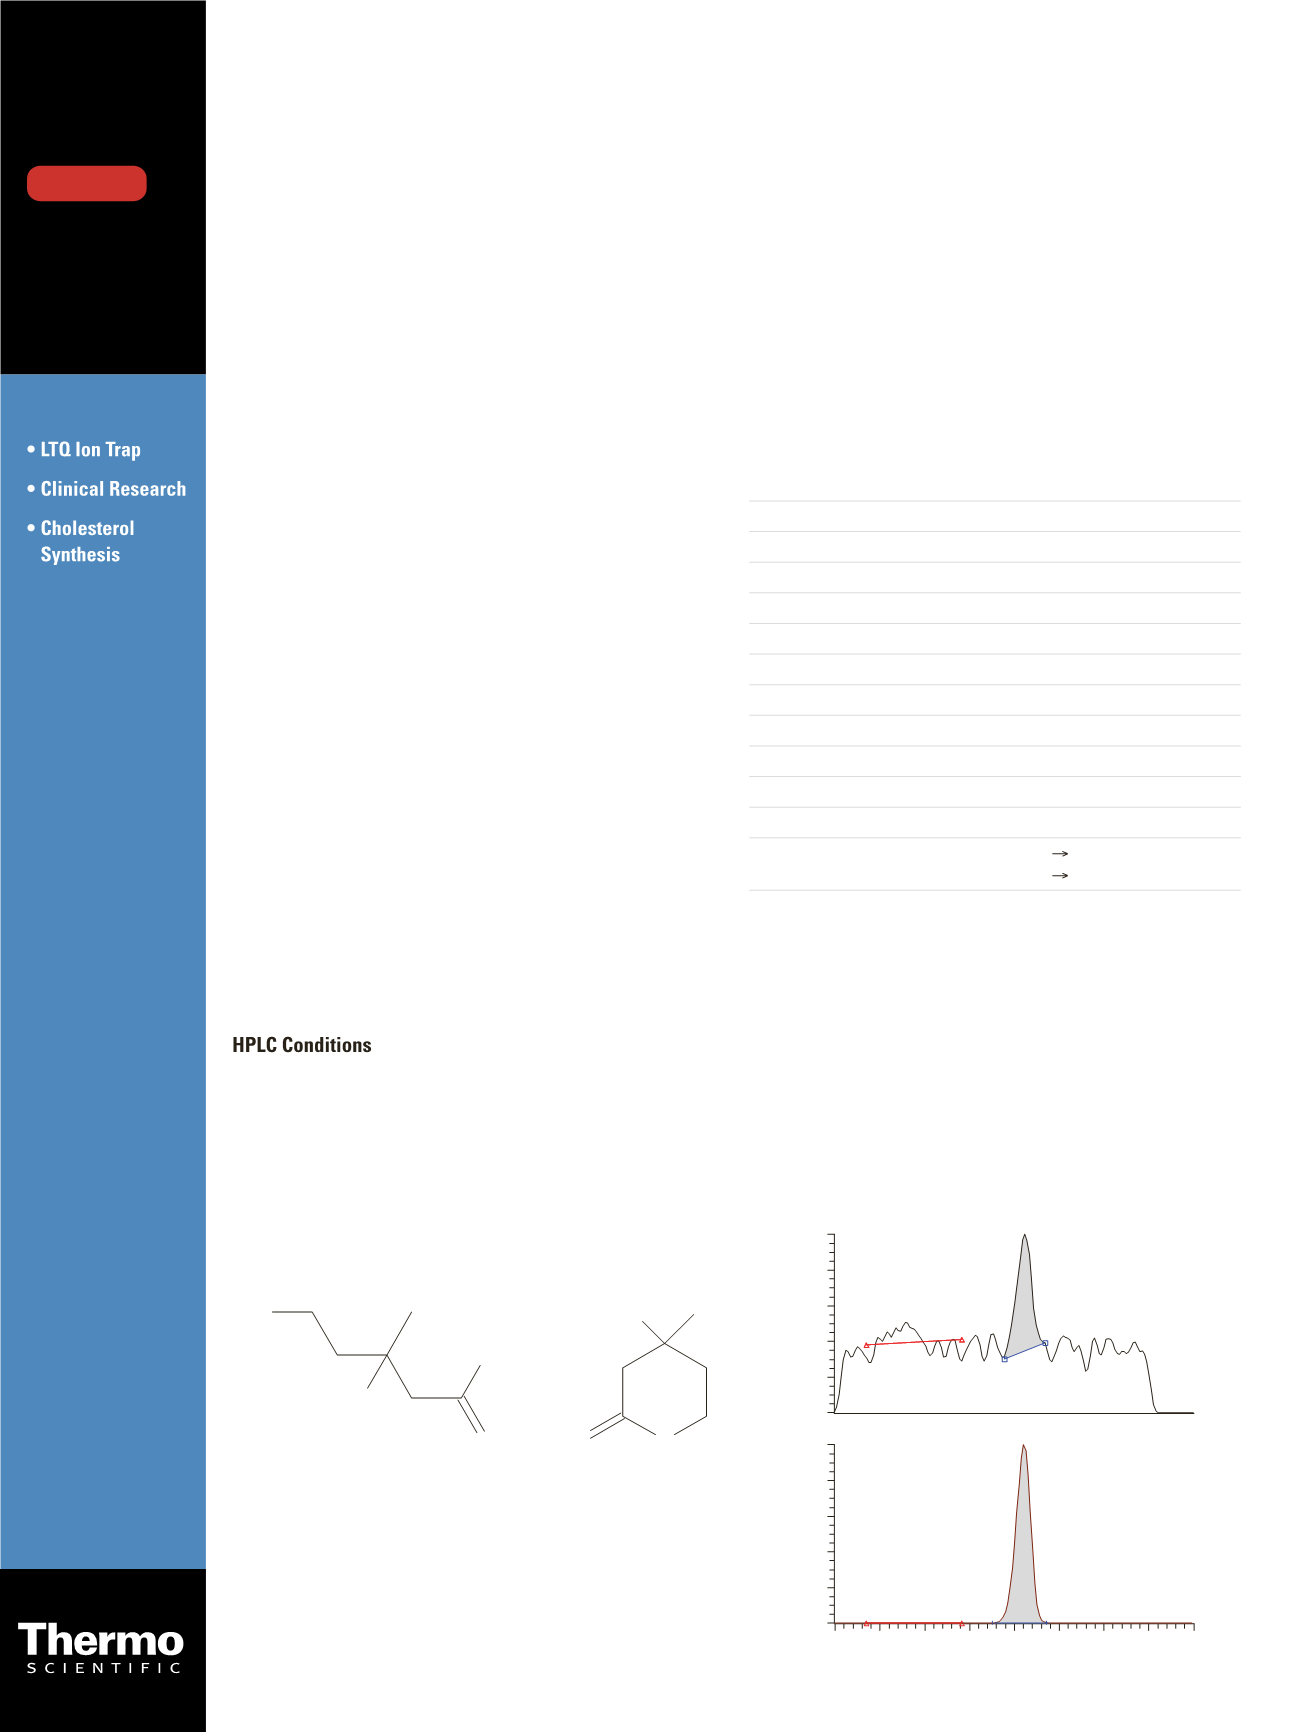
Figure 2 shows the ion chromatograms of a lower sample
of the calibration curve. Excellent linearity (r
2
= 0.999) fits
for the calibration curve were observed over the range of
2.5 - 250 ng/mL plasma (Figures 3 and 4). The intraday
CV% (n=3) was in the range 0.5% - 4%. The limit of
detection (LOD) was 2 pg, and the limit of quantification
(LOQ) was 2.5 ng/mL.
Figure 5 reports an ion chromatogram of a plasma
sample of a healthy volunteer (24 ng/mL plasma), extract-
ed and analyzed as described.
Mevalonolactone
Mevalonate
O O
HO
HO
O
HO
O -
Figure 1. Structure of mevalonate and mevalonolactone
Mevalonate
Mevalonate-D
7
3.0 3.5 4.0 4.5 5.0 5.5 6.0 6.5 7.0
Time (min)
0
20
40
60
80
100
0
20
40
60
80
100
Relative Abundance
RT: 5.12
RT: 5.10
Figure 2. Ion chromatograms of 2.5 ng/mL calibration standard
DOWNLOAD


