
Results and Discussion
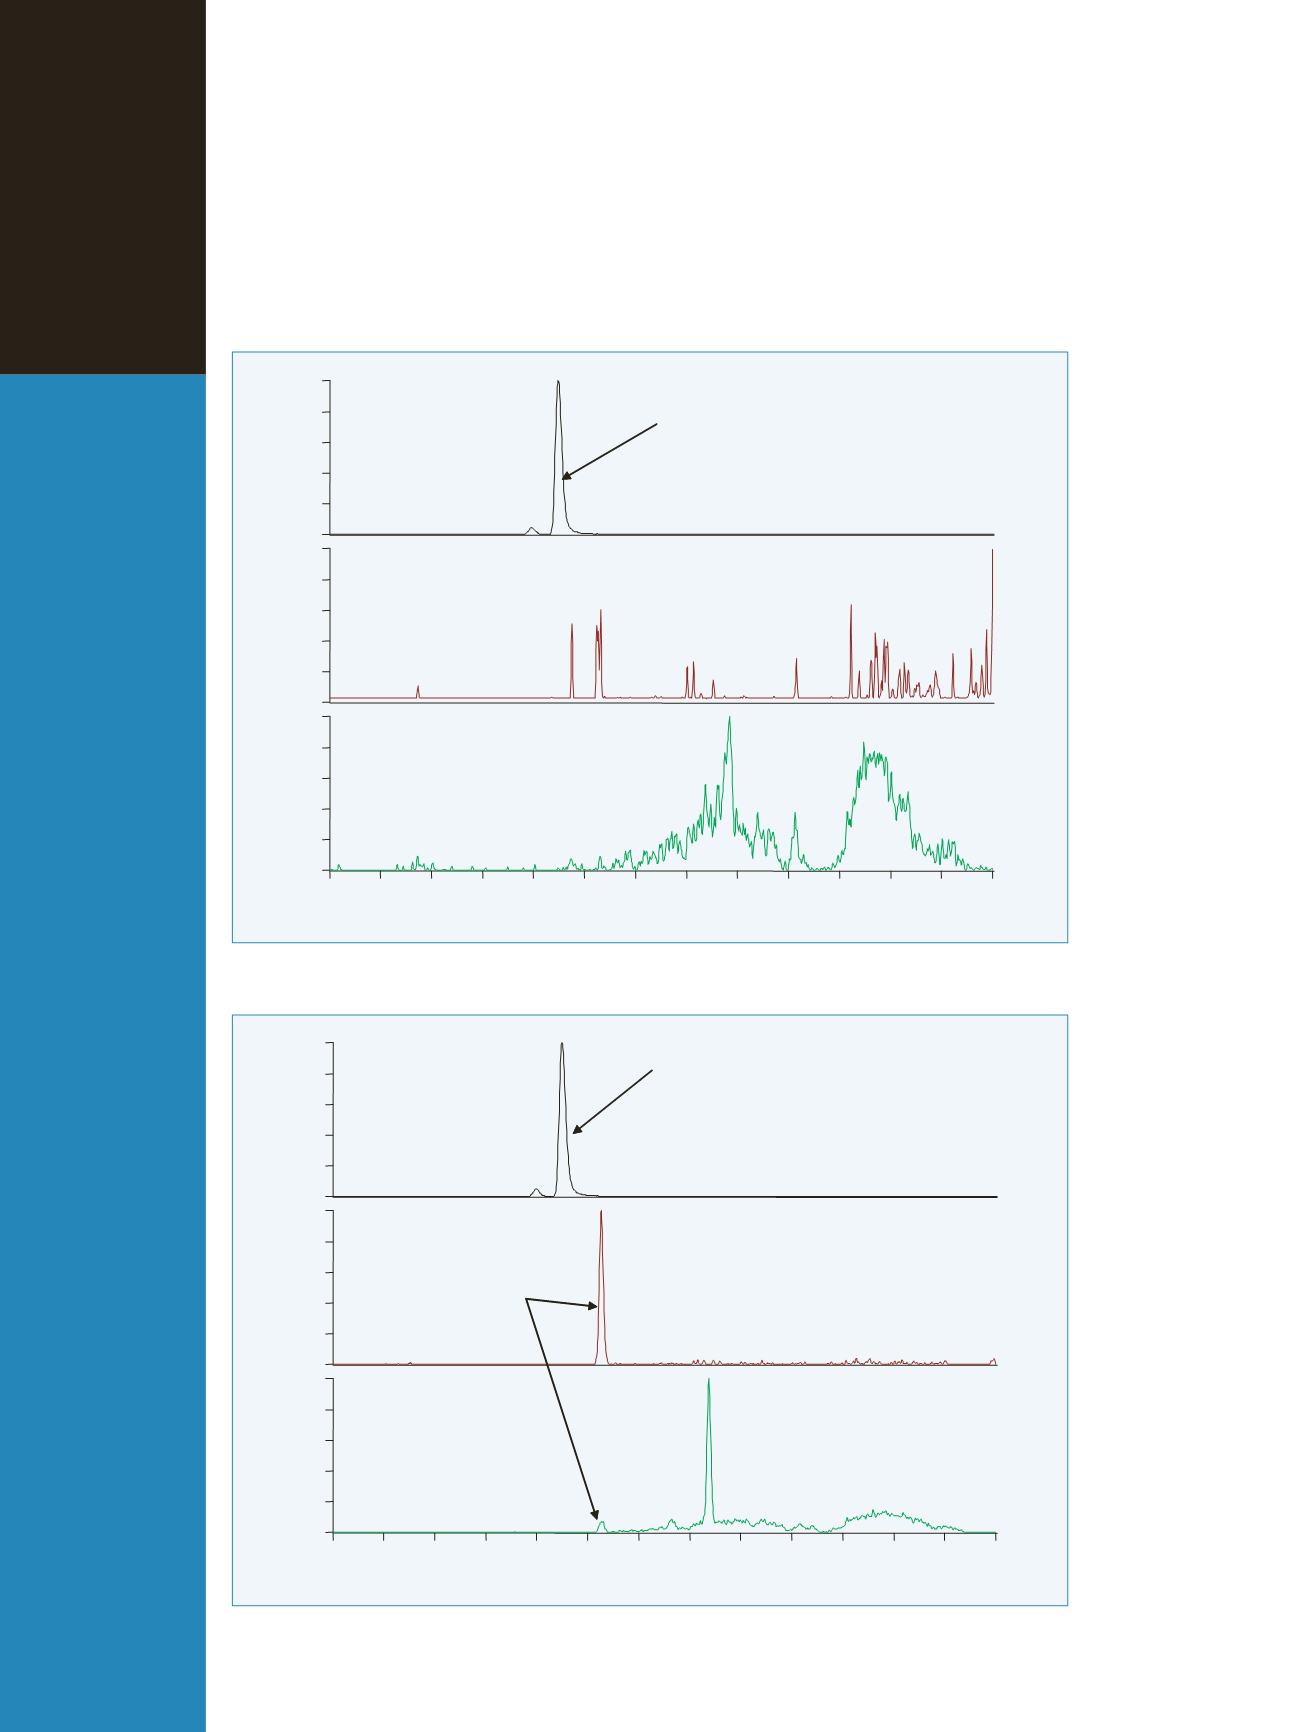
The LC-ESI/SRM chromatograms for 3-aminophenylsul-
fone and digoxin for a blank serum sample and a blank
serum sample spiked at 0.5 ng/mL are shown in Figures
2A and 2B respectively. Identification of digoxin was
achieved with two characteristic SRM transitions and
their relative retention time.
Linearity
Calibration curve obtained for digoxin spiked in serum
samples is presented in Figure 3. Concentration range was
comprised between 0.5 ng/mL and 100 ng/mL.
4.49
100
80
60
40
20
0
100
80
60
40
20
0
100
80
60
40
20
0
0
1
2
3
4
5
6
Time (min)
7
8
9
10
11
12
13
3-aminophenylsulfone
249.1
m/z
> 93.2
m/z
Digoxin
798.5
m/z
> 651.4
m/z
798.5
m/z
> 781.5
m/z
4.50
5.27
7.37
3-aminophenylsulfone
Digoxin
100
80
60
40
20
0
100
80
60
40
20
0
100
80
60
40
20
0
0
1
2
3
4
5
6
Time (min)
7
8
9
10
11
12
13
249.1
m/z
> 93.2
m/z
798.5
m/z
> 651.4
m/z
798.5
m/z
> 781.5
m/z
Figure 2A: Chromatogram of a blank serum
Figure 2B: Chromatogram of a blank serum spiked at 0.5 ng/mL


