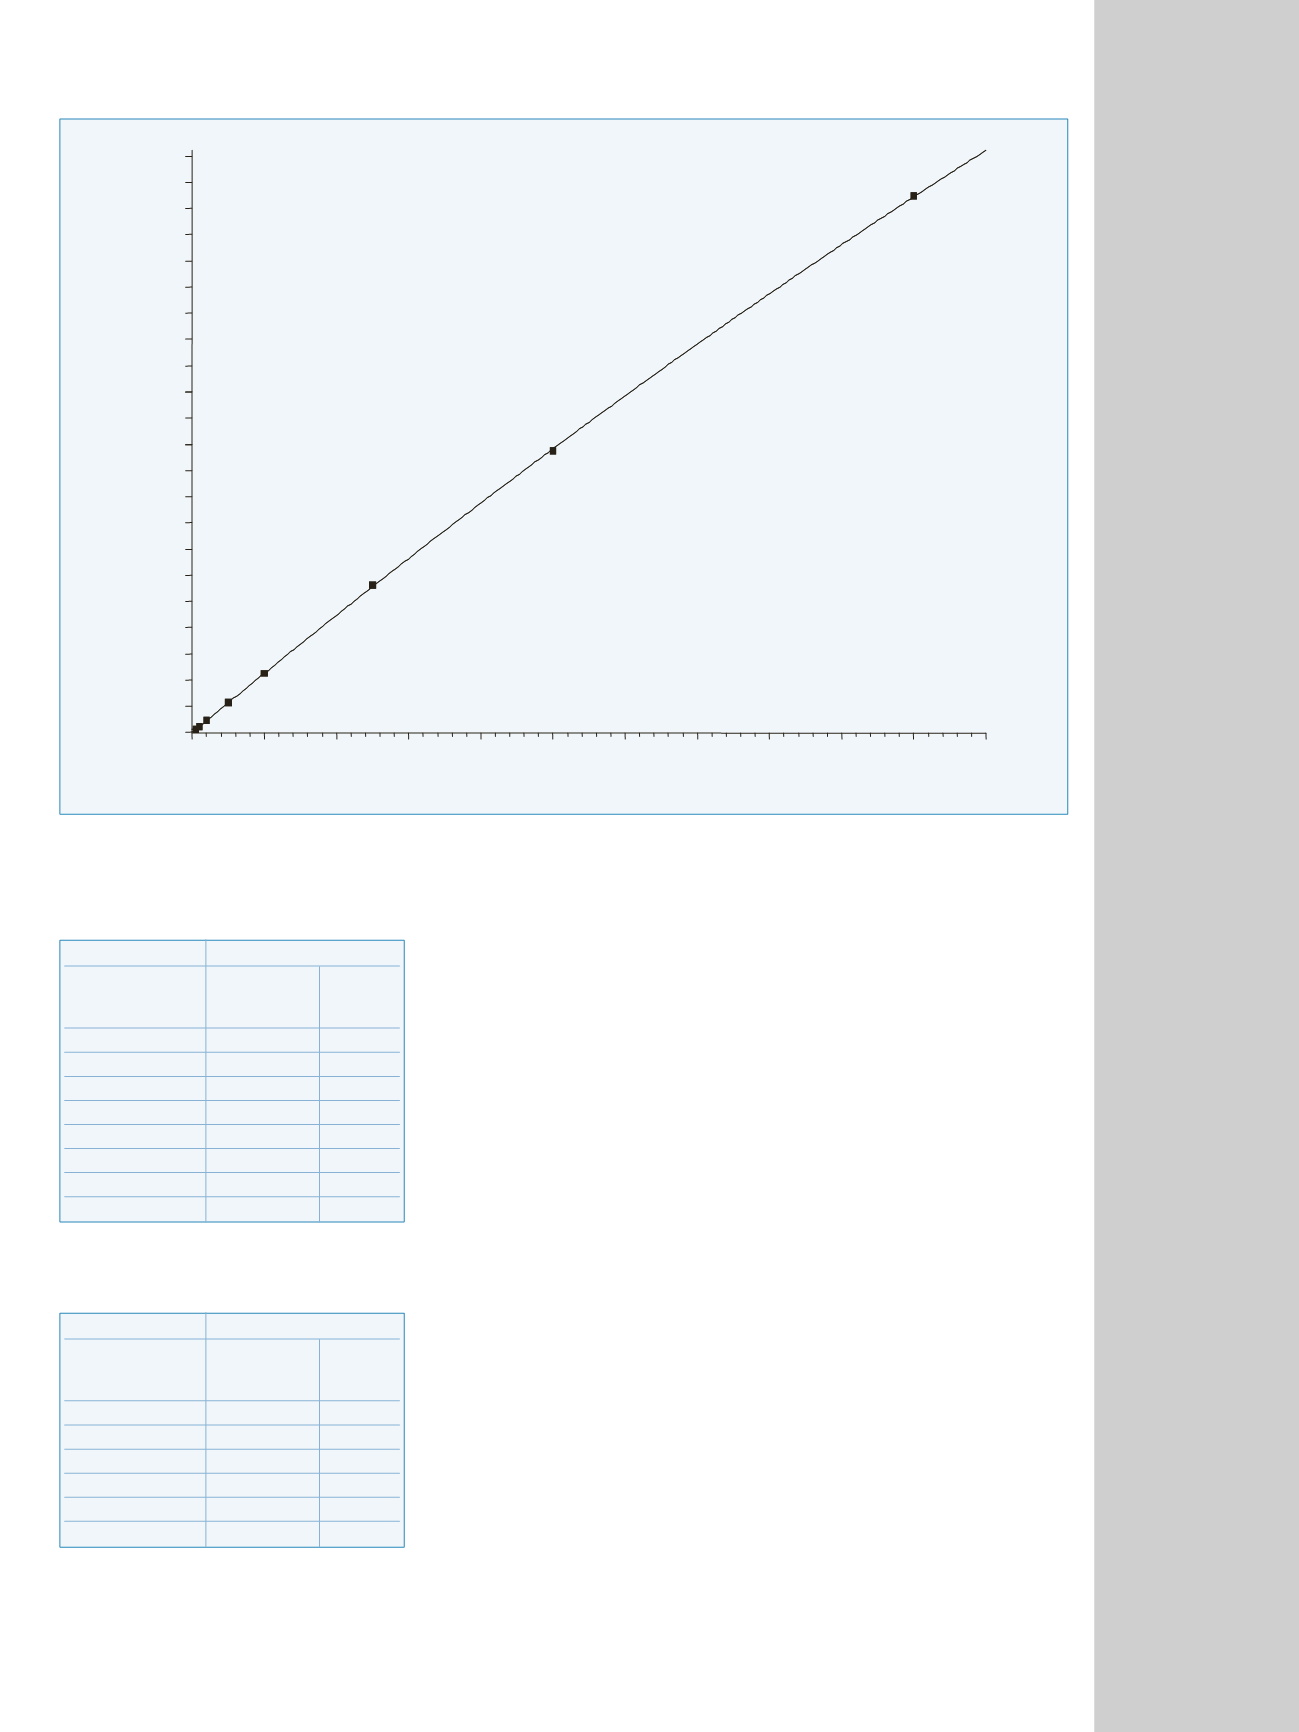

Digoxin
R^2 = 1.0000 W: 1/X
0
10
2.2
2.1
2.0
1.9
1.8
1.7
1.6
1.5
1.4
1.3
1.2
1.1
1.0
0.9
0.8
0.7
0.6
0.5
0.4
0.3
0.2
0.1
0.0
20
30
40
ng/mL
Area Ratio
50
60
70
80
90
100
110
Y=-2.4496e-005*X^2+0.0228987*X-0.000314885
Figure 3: Representative calibration curve from standards spiked in serum
Quadratic 1/x
Specified
Calculated
Concentration Amount
%
(ng/mL)
(ng/mL)
Diff
0.5
0.503
0.53
1
.0972
-2.79
2
2.041
2.07
5
5.001
0.02
10
9.985
-0.15
25
25.239
0.95
50
49.614
-0.77
100
100.149
0.15
Corresponding Results
of Calibration Standards
Quadratic 1/x
Specified
Calculated
Concentration Amount
%
(ng/mL)
(ng/mL)
Diff
0.5
0.514
2.76
0.5
0.496
-0.75
0.5
0.546
9.10
0.5
0.558
11.62
0.5
0.510
1.97
0.5
0.563
12.62
Intra-assay Accuracy
and Precision (n=6)
Accuracy and precision
Intra-assay accuracy and precision (n=6) have been
studied at the lowest concentration (0.5 ng/mL). Relative
Standard Deviation was equal to 5.28% and Mean
Relative Error to 6.23%.
Conclusion
This application note describes a sensitive and specific
method developed for the quantitation of digoxin in
serum for research applications.


