
Part of Thermo Fisher Scientific
www.thermoscientific.comLegal Notices: ©2010 Thermo Fisher Scientific Inc. All rights reserved. ClinMass
®
is a registered trademark of RECIPE Chemicals + Instruments GmbH. All other
trademarks are the property of Thermo Fisher Scientific Inc. and its subsidiaries. This information is presented as an example of the capabilities of Thermo Fisher
Scientific Inc. products. It is not intended to encourage use of these products in any manners that might infringe the intellectual property rights of others. Specifica-
tions, terms and pricing are subject to change. Not all products are available in all countries. Please consult your local sales representative for details.
Thermo Fisher Scientific,
San Jose, CA USA is ISO Certified.
AN63349_E 12/10S
In addition to these
offices, Thermo Fisher
Scientific maintains
a network of represen-
tative organizations
throughout the world.
Africa-Other
+27 11 570 1840
Australia
+61 3 9757 4300
Austria
+43 1 333 50 34 0
Belgium
+32 53 73 42 41
Canada
+1 800 530 8447
China
+86 10 8419 3588
Denmark
+45 70 23 62 60
Europe-Other
+43 1 333 50 34 0
Finland/Norway/
Sweden
+46 8 556 468 00
France
+33 1 60 92 48 00
Germany
+49 6103 408 1014
India
+91 22 6742 9434
Italy
+39 02 950 591
Japan
+81 45 453 9100
Latin America
+1 561 688 8700
Middle East
+43 1 333 50 34 0
Netherlands
+31 76 579 55 55
New Zealand
+64 9 980 6700
Russia/CIS
+43 1 333 50 34 0
South Africa
+27 11 570 1840
Spain
+34 914 845 965
Switzerland
+41 61 716 77 00
UK
+44 1442 233555
USA
+1 800 532 4752
Table 3. Summary of assay performance and therapeutic range
Therapeutic Range
LOQ
Linearity Range
[ng/mL]
[ng/mL]
[ng/mL]
I.S.
Tacrolimus
2 - 15
0.13
1.3 - 46.7
Ascomycin
Sirolimus
5 - 15
0.13
1.3 - 46.9
d
4
-Everolimus
Everolimus
6 - 8
0.13
1.3 - 47.4
d
4
-Everolimus
Cyclosporin A
100 - 350
24.90
24.90 - 1264.0
Cyclosporin D
Tacrolimus
Ascomycin I.S.
Sirolimus
Everolimus
d
4
-Everolimus I.S.
Cyclosporin A
Cyclosporin D I.S.
0.0
0.2
0.4
0.6
0.8
1.0
1.2
1.4
1.6
1.8
2.0
Time (min)
0
50
100
0
50
100
0
50
100
0
50
100
Relative Abundance
0
50
100
0
50
100
0
50
100
RT:1.25
RT:1.24
RT:1.29
RT:1.32
RT:1.31
RT:1.42
RT:1.47
NL:1.97E3
TIC F:+cESISRMms2
821.560 [768.405-768.455] MS
ICISCal1_B
NL:5.50E4
TIC F:+cESISRMms2
809.500 [756.575-756.625] MS
ICISCal1_B
NL:5.10E2
TIC F:+cESISRMms2
931.654 [864.545-864.595] MS
ICISCal1_B
NL:4.55E2
TIC F:+cESISRMms2
975.672 [908.775-908.825] MS
ICISCal1_B
NL:3.12E3
TIC F:+cESISRMms2
979.700 [912.575-912.625] MS
ICISCal1_B
NL:1.61E2
TIC F:+cESISRMms2
1220.026 [1203.275-1203.325]
MS ICIS Cal1_B
NL:9.80E3
TIC F:+cESISRMms2
1234.000 [1216.975-1217.025]
MS ICIS Cal1_B
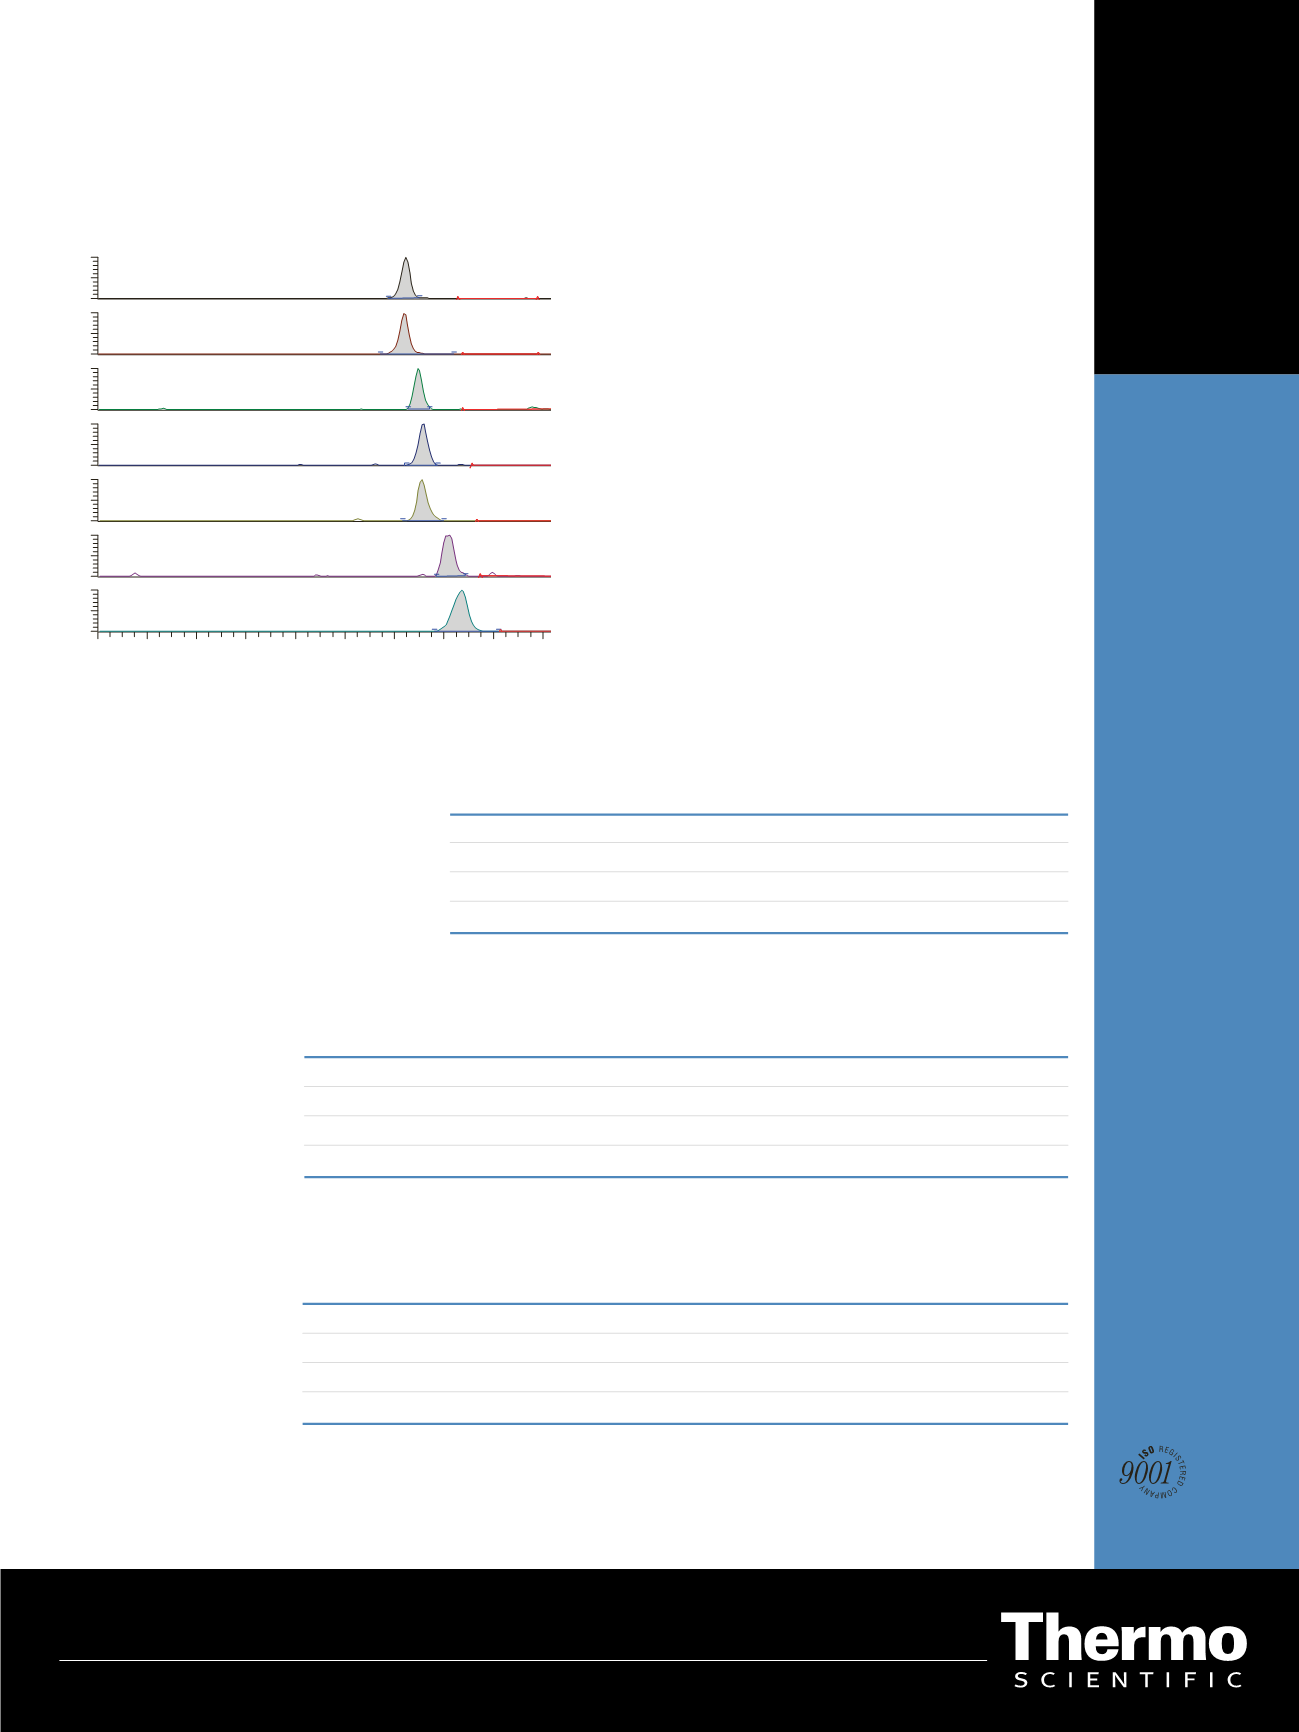
Figure 1: Chromatograms of the lowest calibration standard
Results and Discussion
Figure 1 displays the representative lower limit of quantifi-
cation (LLOQ) chromatograms for Tacrolimus, Sirolimus,
Everolimus, Cyclosporin A, and the internal standards.
In Table 3, the LLOQ and the linearity range for each
analyte are reported and compared to the therapeutic
range.
As shown in Tables 4 and 5, the intra- and inter-day
variabilities were excellent as well as accurate. For each
analyte, intra-day variability and accuracy were deter-
mined by performing two different extractions of each QC
sample and analyzing them two times. Inter-day variability
and accuracy were determined by repeating the intra-day
procedure on three different days. Sample extractions were
performed by different people.
Conclusion
A fast and reliable LC-MS/MS method for the quantifica-
tion of Tacrolimus, Sirolimus, Everolimus, and Cyclo-
sporin A in whole blood was validated using the RECIPE
ClinMass
®
Complete Kit.
This method fulfills accuracy, precision, and dynamic
range requirements of a routine method for clinical re-
search.
Table 4. Intra-day variability (%RSD) and accuracy
QC 1
QC 2
QC 3
Value
%RSD %Accuracy
Value
%RSD %Accuracy
Value
%RSD
%Accuracy
Tacrolimus
3.28
6.7
90.1
6.67
2.9
96.3
13.3
5.5
99.4
Sirolimus
3.64
2.7
81.7
11.20
3.8
93.6
18.9
5.2
101.8
Everolimus
3.34
7.2
90.1
10.60
7.1
97.4
18.2
7.2
101.5
Cyclosporin A
62.50
11.4
101.7
258.00
6.2
102.9
1341.0
2.8
94.6
Table 5. Inter-day variability (%RSD) and accuracy
QC 1
QC 2
QC 3
Value
%RSD %Accuracy
Value
%RSD %Accuracy
Value
%RSD
%Accuracy
Tacrolimus
3.28
4.7
92.5
6.67
2.1
97.4
13.3
3.3
99.4
Sirolimus
3.64
8.4
89.6
11.20
4.6
95.7
18.9
5.1
102.8
Everolimus
3.34
7.6
96.7
10.60
5.1
96.5
18.2
4.7
100.9
Cyclosporin A
62.50
15.6
103.4
258.00
6.7
99.0
1341.0
12.0
102.9


