
300 µL/min with a linear gradient of 10% solvent B
(Methanol/Ammonium acetate [10 mM] 90/10 v/v) to
100% B over 5 minutes. Solvent A was Ammonium
acetate (10 mM). The calibration standards were injected
in duplicate at volumes of 10 µL.
MS Conditions
Mass spectrometer: TSQ Quantum
Ionization mode: Electrospray (ESI), positive ion
SRM: Clenbuterol 277.1
→
203.0 ± 0.3 Da, 22 eV
Collision energy Resolution
Experiment 1
: 0.7 Da FWHM on Q1 and Q3
Experiment 2
: 0.1 Da FWHM on Q1, 0.7 Da
FWHM on Q3
Two separate quantitative analyses were performed
at peak widths of 0.1 Da and 0.7 Da Full Width Half
Maximum (FWHM) on Q1 in SRM mode. A peak width
of 0.7 Da FWHM was used on Q3 for all analyses.
Results
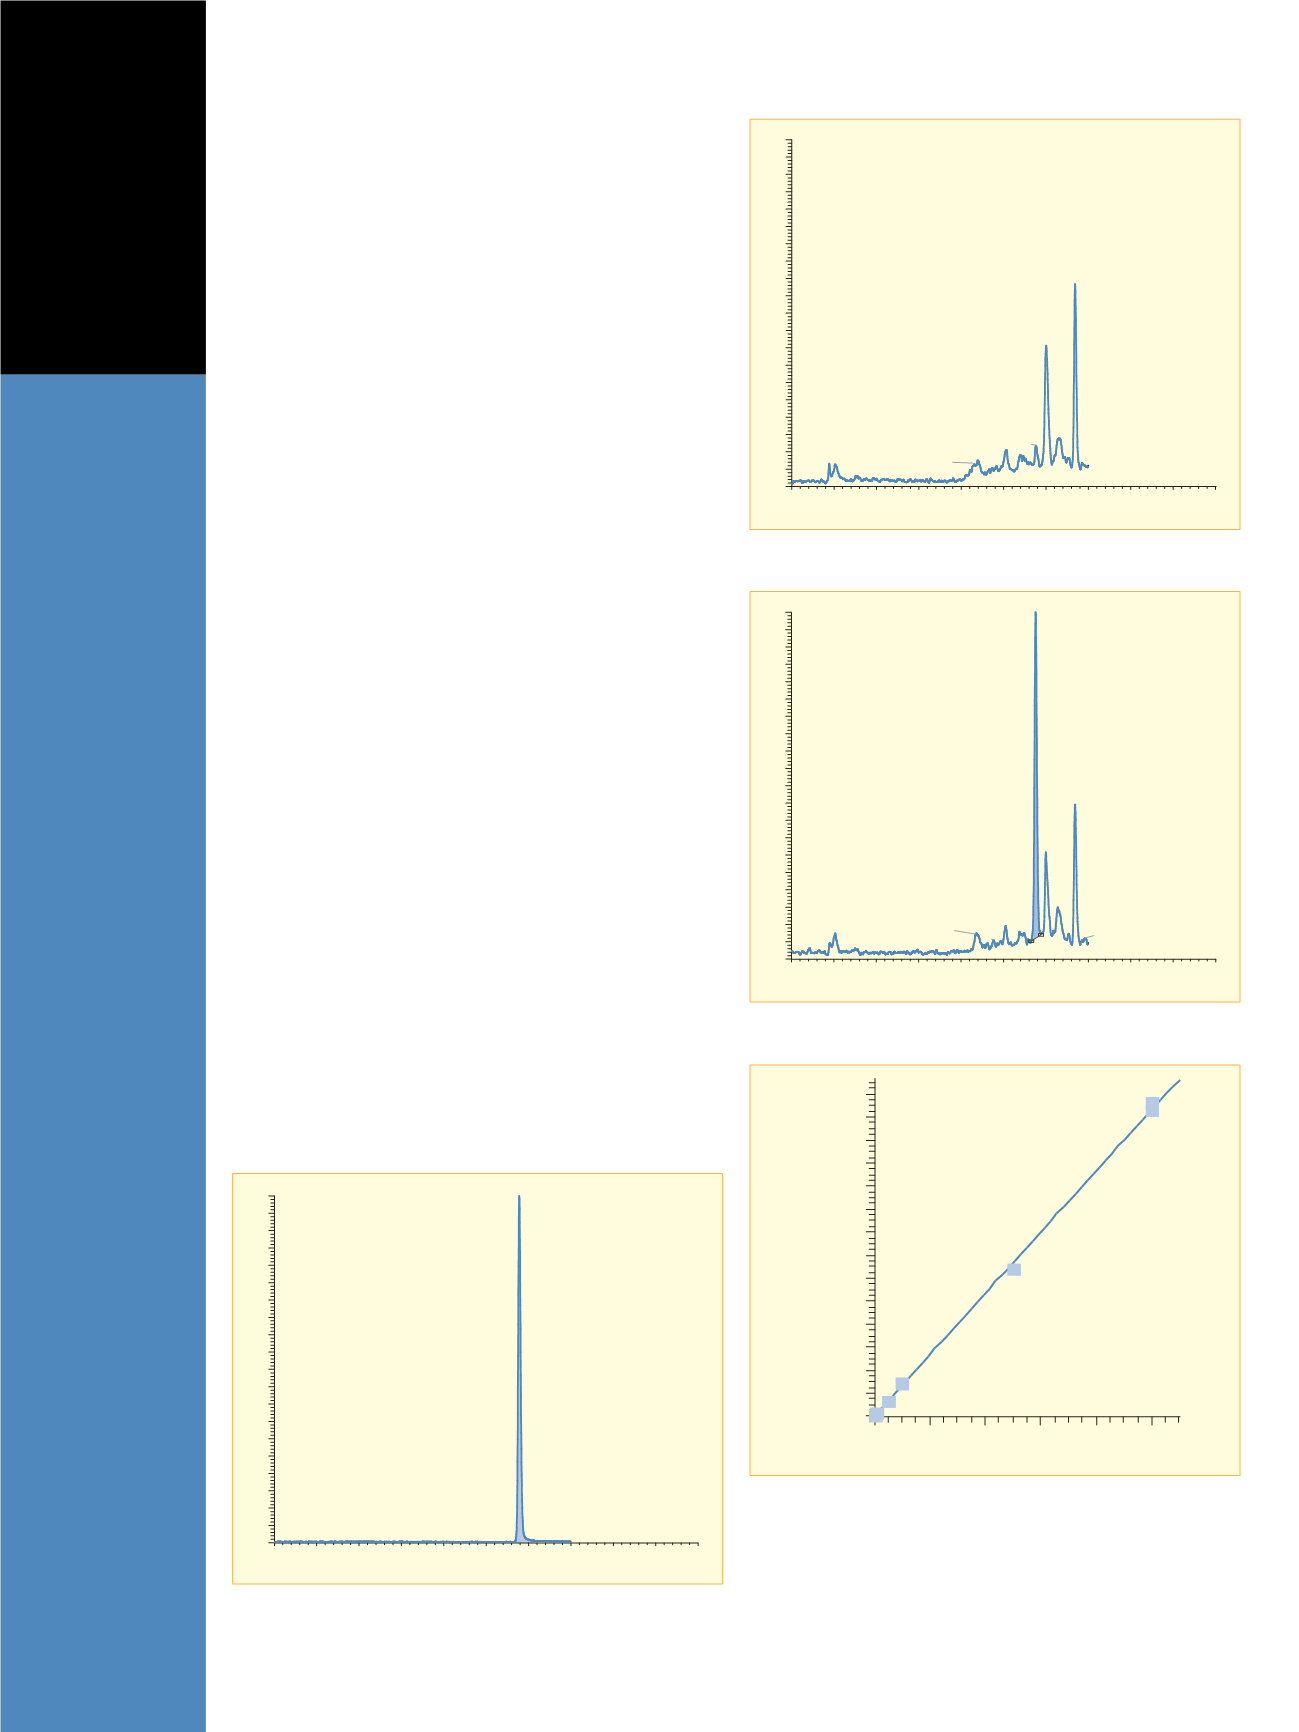
The chromatogram of a pure standard of Clenbuterol in
aqueous solvent demonstrates the retention time at 5.8
minutes (Figure 3).
Experiment 1: Quantitative Analysis Performed
at 0.7 Da FWHM
The data below shows the quantitative analysis of
Clenbuterol in Human urine at peak width settings of 0.7
Da FWHM on Q1 and Q3. Chromatograms are shown
for blank urine (Figure 4) and urine containing
Clenbuterol at 0.1 pg/µL (Figure 5).
A calibration curve of Clenbuterol analyzed at 0.7 Da
FWHM was constructed using linear fit of peak area
plotted against concentration, weighted 1/x (Figure 6).
A correlation coefficient of r
2
=0.9990 with an equation
of Y=8496.82+266143*X was obtained for the curve.
The peak area, back-calculated values and precision
of all calibration standards are shown in Table 1.
0
1
2
3
4
5
6
7
8
9
10
Time (min)
0
5
10
15
20
25
30
35
40
45
50
55
60
65
70
75
80
85
90
95
100
RT: 5.78
Figure 3: Determination of Clenbuterol retention time
0
1
2
3
4
5
6
7
8
9
10
Time (min)
0
5
10
15
20
25
30
35
40
45
50
55
60
65
70
75
80
85
90
95
100
6.68
6.00
5.76
5.07
4.39
6.85
0.88
4.30
Figure 4: Urine blank, 0.7 Da FWHM
0
1
2
3
4
5
6
7
8
9
10
Time (min)
0
5
10
15
20
25
30
35
40
45
50
55
60
65
70
75
80
85
90
95
100
RT: 5.76
6.69
6.00
6.28
5.05
5.38
4.36
1.03
4.34
6.92
4.76
Figure 5: Clenbuterol, 0.1 pg/µL in urine, 0.7 Da FWHM
Clenbuterol
0
20
40
60
80
100
pg/L
0
2000000
4000000
6000000
8000000
10000000
12000000
14000000
16000000
18000000
20000000
22000000
24000000
26000000
28000000
Figure 6: Clenbuterol curve at 0.7 Da FWHM


