
Improved Quantitative Selectivity of Clenbuterol
in Human Urine Using High Resolution on the
TSQ Quantum Mass Spectrometer
Mark Churchill,
1
Mark Harrison,
1
John Henninge,
2
and Hanne Lund
2
1
Thermo Fisher Scientific, Stafford House, 1 Boundary Park, Boundary Way, Hemel Hempstead, HP2 7GE, UK;
2
Aker University Hospital, Hormone Laboratory, Section for Doping Analysis, Trondheimsveien, N-0514, Oslo, Norway
Key Words
• TSQ Quantum
™
• High Resolution
Analysis
• Improved
Sensitivity
• Quantitation
Application
Note: 310
The data presented here was acquired on a
TSQ Quantum mass spectrometer.
Introduction
Clenbuterol (Figure 1) is a beta-2-adrenergic agonist,
an effective bronchodilator drug used for the treatment
of human asthma. It relieves bronchial airway smooth
muscle contractions caused by Chronic Obstructive
Pulmonary Disease (COPD) and allergy-induced
respiratory distress.
Clenbuterol has significant anabolic effects and could
be used as a drug of abuse in athletes and livestock for
its muscle growth stimulant properties. It raises the body
temperature and hence facilitates fat tissue catabolism.
Due to Clenbuterol having these anabolic properties,
it must be routinely monitored in biological samples
by veterinary and human doping control laboratories.
Goal
One of the limitations to quantitation is the unequivocal
identification of analytes in biological samples due to
endogenous matrix interferents.
This report describes the use of high resolution on the
Thermo Scientific TSQ Quantum to exploit the negative
mass defect of a compound containing Chlorine, such as
Clenbuterol, and hence improve the selectivity of the
quantitative assay.
Clenbuterol (C
12
H
18
Cl
2
N
2
O, molecular weight 276.08
amu) was infused, 0.1 ng/µL, into the ESI source and the
four most abundant product ions for the MS/MS break-
down were determined using the automated compound
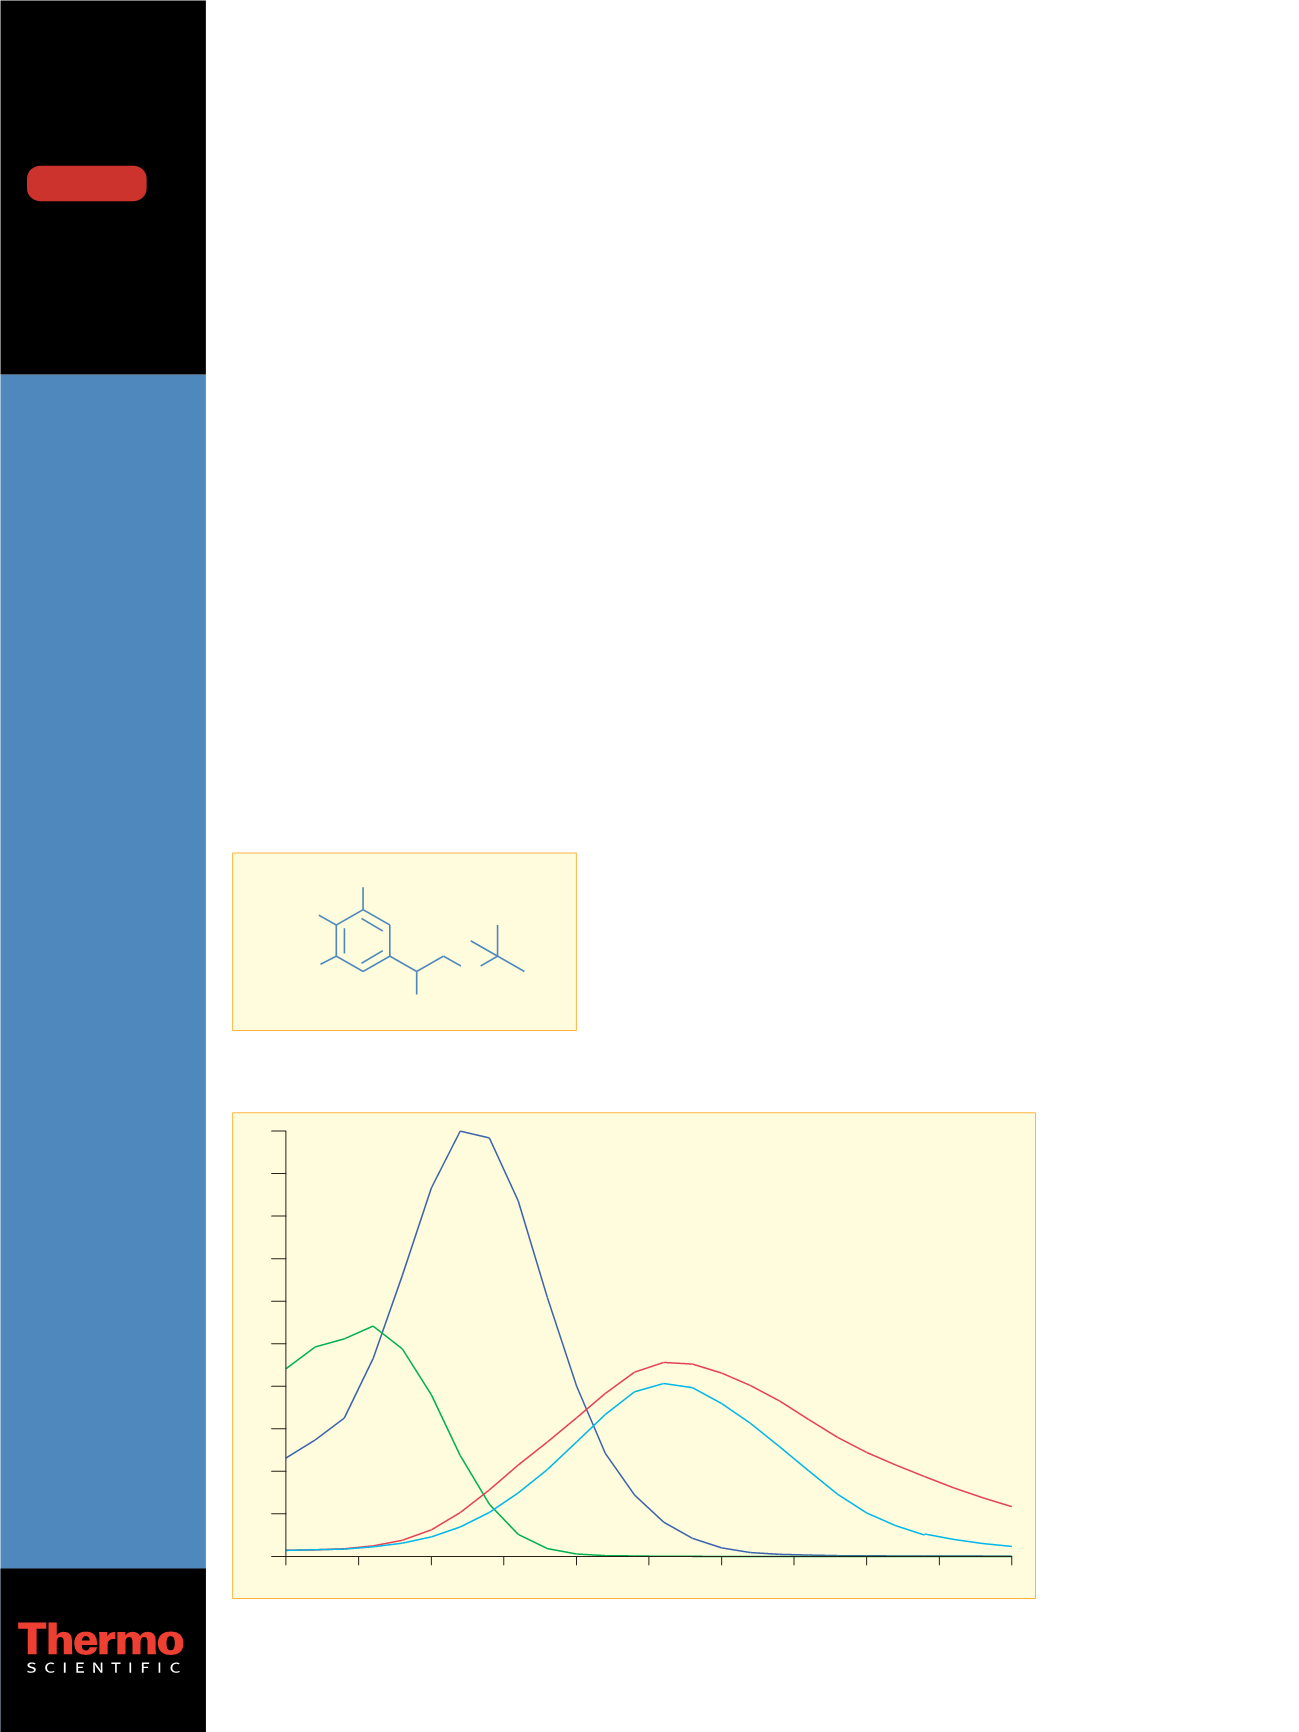
optimization procedure on the TSQ Quantum (Figure 2).
The transition yielding the most abundant product ion
(
m/z
203.0) was selected for the analysis of Clenbuterol.
Experimental Conditions
Sample Preparation:
Human urine extracts were prepared
using a C18 Solid Phase Extraction media. The extracted
urine was spiked with Clenbuterol in the concentration
range 0.1, 0.5, 1, 5, 10, 50 and 100 pg/µL for the calibra-
tion standards. No internal standard was used in this study.
Sample Analysis:
The spiked urine extracts were
chromatographed using a Thermo Scientific Surveyor
™
LC on a C18 100 mm
×
2.1 mm column at a flow rate of
H
2
N
Cl
NH
OH
Cl
Figure 1: Chemical structure of Clenbuterol
100
80
60
40
20
0
10
20
30
40
50
60
Breakdown Curve of Ion 277.1 m/z
Product Ions
Coll.Energy
203.0 m/z
22 v
259.0 m/z
16 v
132.0 m/z
36 v
168.0 m/z
36 v
Intensity: 1.64e+07
Pressure: 1.5 mTorr
Figure 2: Automated optimization of MS/MS parameters for Clenbuterol
DOWNLOAD


