
Experiment 2: Quantitative Analysis Performed
at 0.1 Da FWHM
The data below shows the quantitative analysis of
Clenbuterol in Human urine at peak width settings
of 0.1 Da FWHM on Q1 and 0.7 Da FWHM on Q3.
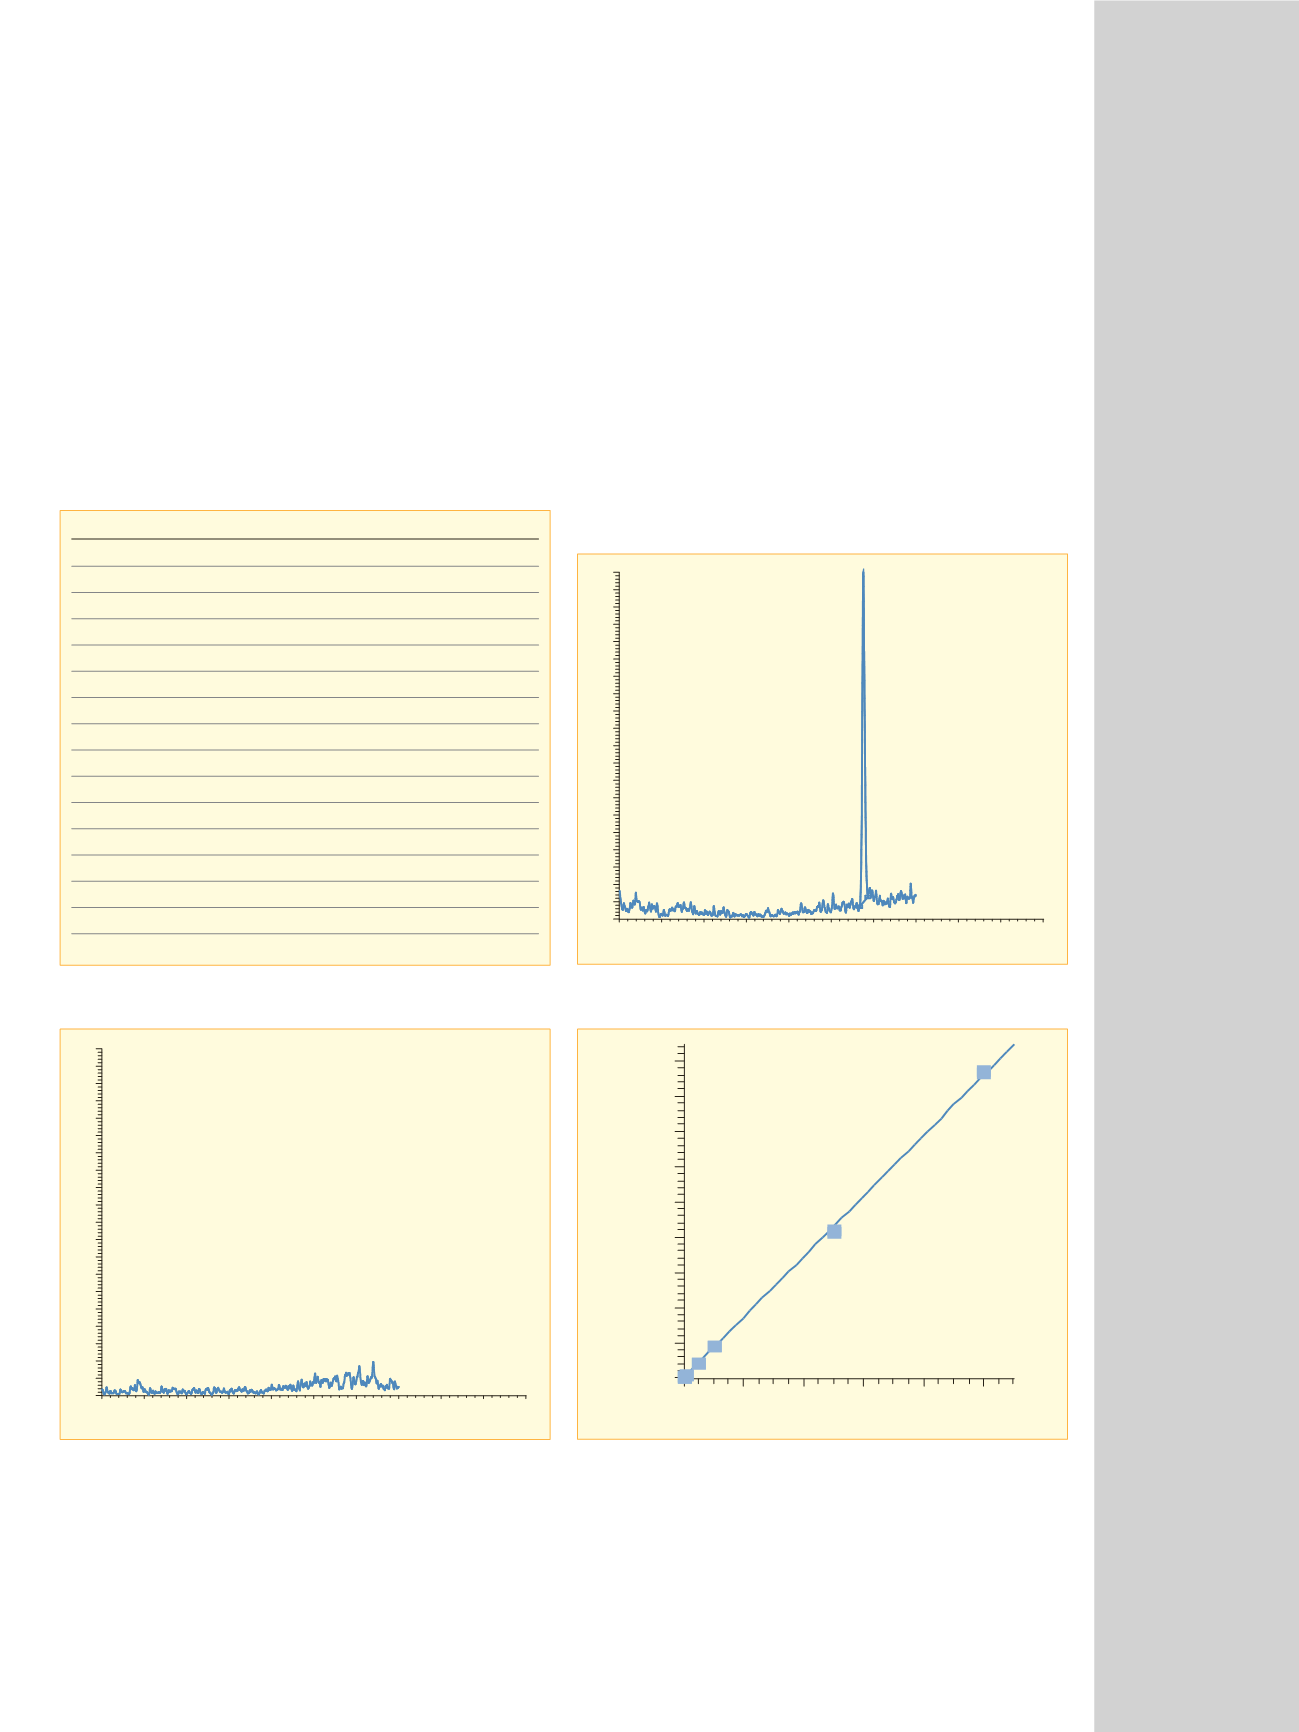
Chromatograms are shown for blank urine (Figure 7)
and urine containing Clenbuterol at 0.1 pg/µL (Figure 8).
A calibration curve of Clenbuterol analyzed at 0.1 Da
FWHM was constructed using linear fit of peak area
plotted against concentration, weighted 1/x (Figure 9).
A correlation coefficient of r
2
=0.9994 with an equation
of Y=2661.76+85951.1*X was obtained for the curve.
The peak area, back-calculated values and precision
of all calibration standards are shown in Table 2.
Discussion
Analysis, in SRM mode, of the spiked urine samples
at a resolution setting of 0.7 Da FWHM resulted in a
Clenbuterol peak eluting from the column upon a broad
chemical noise background signal containing interferent
peaks from the urine.
The same urine samples analyzed at a peak resolution
setting of 0.1 Da FWHM resulted in elimination of the
interfering isobaric mass peaks and the broad background
chemical noise previously seen in the analysis at a peak
width setting of 0.7 Da FWHM. The selected reaction
monitoring analysis performed at a higher resolution
setting of 0.1 Da FWHM resulted in increased selectivity
of the assay and hence an increase in the precision that
could be achieved.
SAMPLE NAME AREA
CALC AMT UNITS %RSD
Urine blank
0.00
0.00
pg/L
Urine blank
0.00
0.00
pg/L
Cal 0.1 pg/L
33516.83
0.09
pg/L
4.5%
Cal 0.1 pg/L
31977.14
0.09
pg/L
4.5%
Cal 0.5 pg/L
136967.28
0.48
pg/L
0.6%
Cal 0.5 pg/L
137996.57
0.49
pg/L
0.6%
Cal 1 pg/L
289917.16
1.05
pg/L
1.3%
Cal 1 pg/L
295117.95
1.07
pg/L
1.3%
Cal 5 pg/L
1353210.91
5.05
pg/L
0.8%
Cal 5 pg/L
1338935.79
4.99
pg/L
0.8%
Cal 10 pg/L
2856289.00
10.70
pg/L
0.5%
Cal 10 pg/L
2877525.09
10.78
pg/L
0.5%
Cal 50 pg/L
12837781.41
48.20
pg/L
0.2%
Cal 50 pg/L
12797548.82
48.05
pg/L
0.2%
Cal 100 pg/L
27232776.65
102.29
pg/L
1.7%
Cal 100 pg/L
26578332.48
99.83
pg/L
1.7%
Table 1: Calculated standards at 0.7 Da FWHM
0
1
2
3
4
5
6
7
8
9
10
Time (min)
0
5
10
15
20
25
30
35
40
45
50
55
60
65
70
75
80
85
90
95
100
Figure 7: Urine blank, 0.1 Da FWHM
0
1
2
3
4
5
6
7
8
9
10
Time (min)
0
5
10
15
20
25
30
35
40
45
50
55
60
65
70
75
80
85
90
95
100
RT: 5.76
Figure 8: Clenbuterol, 0.1 pg/µL in urine, 0.1 Da FWHM
Clenbuterol
0
20
40
60
80
100
pg /µL
0
9000000
8000000
7000000
6000000
5000000
4000000
3000000
2000000
1000000
Figure 9: Clenbuterol curve at 0.1 Da FWHM


