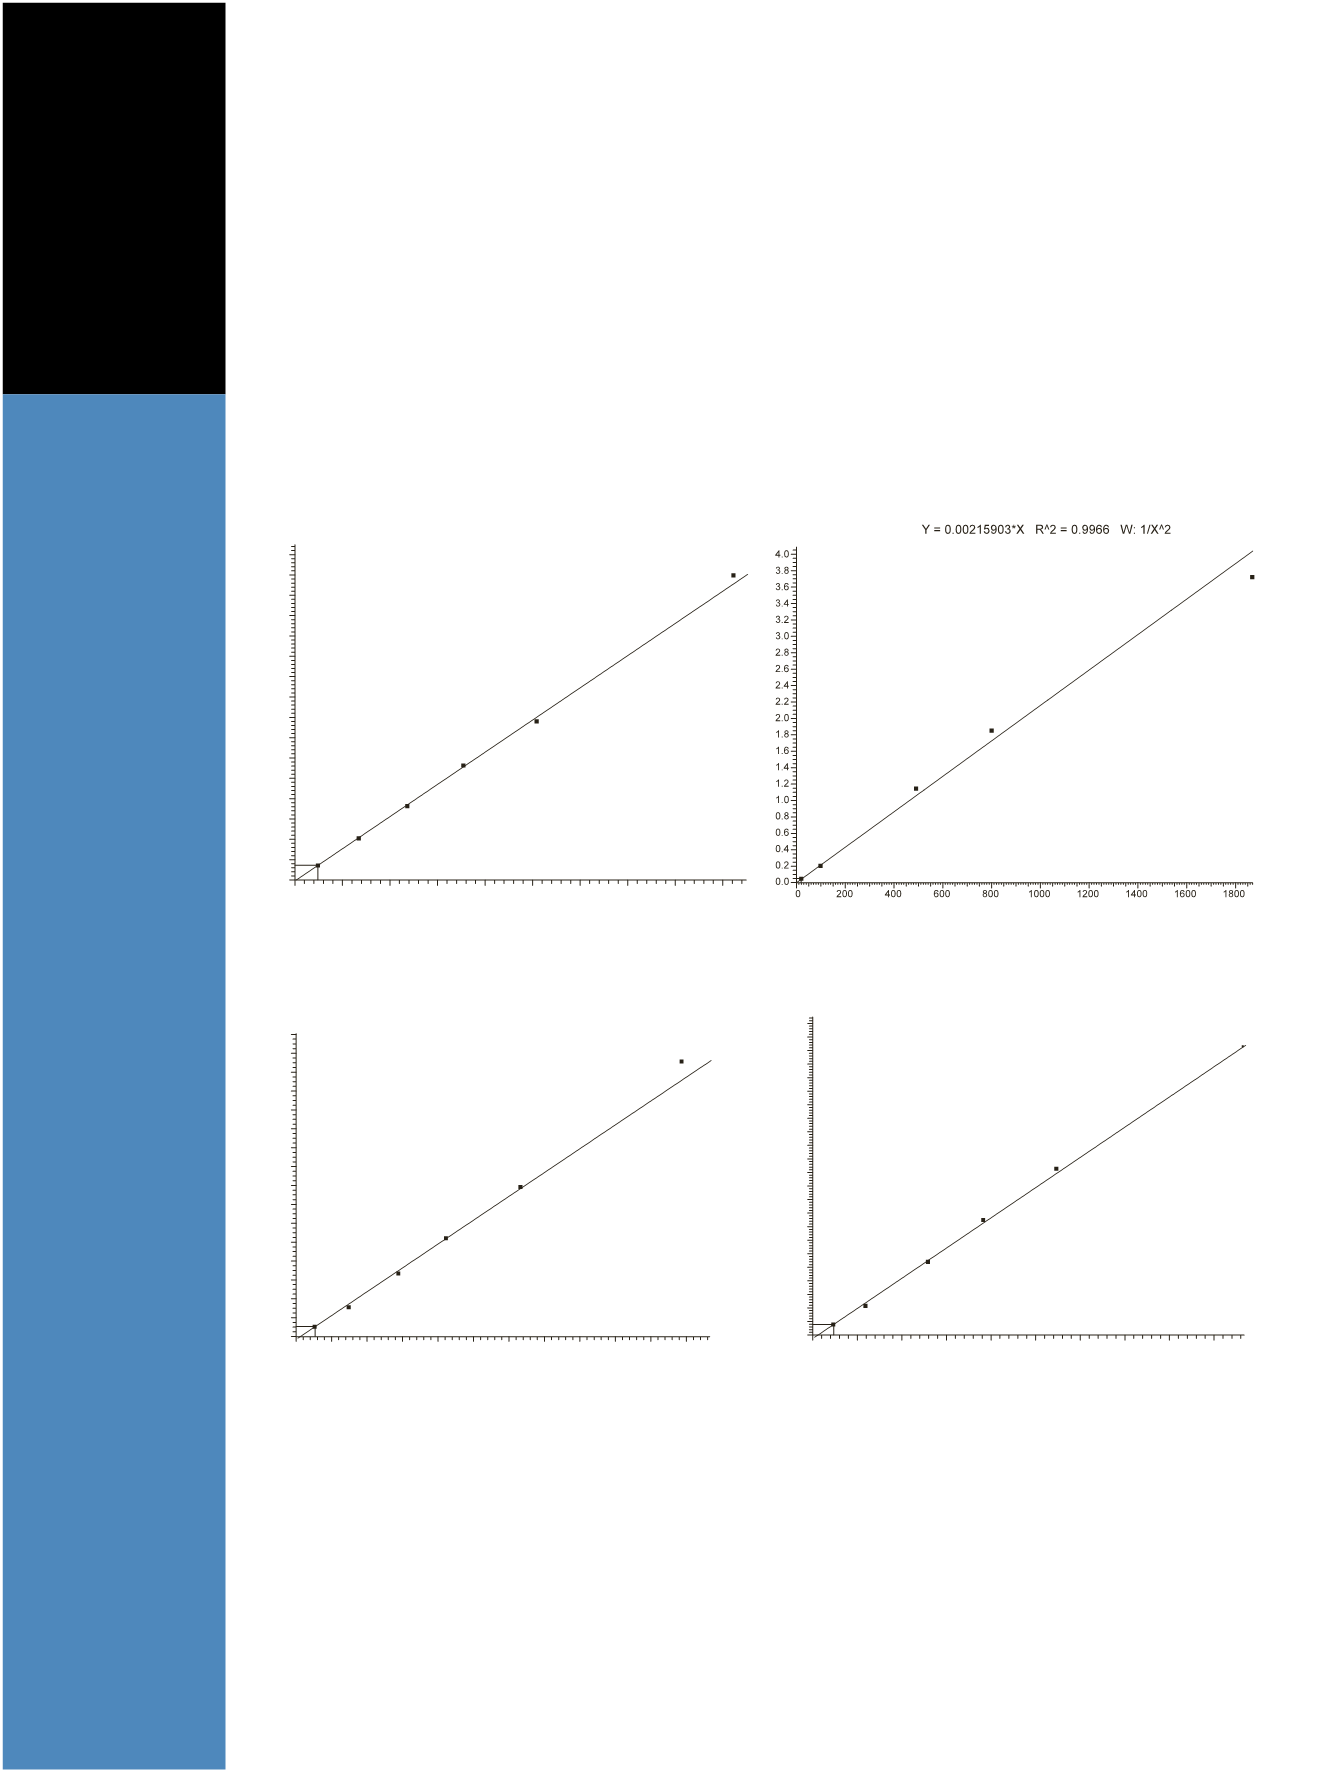

Figure 2. Calibration curves for (A) tacrolimus, (B) cyclosporin, (C) sirolimus, and (D) everolimus
Results and Discussion
An accurate mass extracted ion chromatogram of the
lowest calibration standard for each compound is
presented in Figure 1. An example calibration line for
each of the analytes is presented in Figure 2 A, B, C and D.
Inter-assay variability was determined by processing
30 replicates of each quality control over multiple batches.
The precision data for inter-assay validation are presented
in Table 1. The limit of quantitation (LOQ) has been set
at 1 ng/mL for each analyte, and the highest CVs obtained
at this concentration were 10.2%. The lower limit of
quantitation (LLOQ) has not yet been fully investigated.
Although cyclosporin, which also has the largest concen-
tration range, achieved CVs of 12.5% at 0.3 ng/mL.
A total of 360 clinical research samples were analyzed
by the HRAM method. The results were compared to
the current LC-MS/MS method. Analysis of the clinical
specimens by both HRAM LC-MS and LC-MS/MS
demonstrate good correlation for cyclosporin, tacrolimus,
and sirolimus across the required therapeutic range. No
clinical research specimens were available for the method
comparison of everolimus.
tacrolimus
Y = -0.000230626+0.00158325*X R^2 = 0.9994 W: 1/X^2
0
5
10
15
20
25
30
35
40
45
0.000
0.005
0.010
0.015
0.020
0.025
0.030
0.035
0.040
0.045
0.050
0.055
0.060
0.065
0.070
0.075
0.080
Area Ratio
sirolimus
Y = -0.00301757+0.00505096*X R^2 = 0.9954 W: 1/X^2
0
5 10 15 20 25 30 35 40 45 50 55
0.00
0.02
0.04
0.06
0.08
0.10
0.12
0.14
0.16
0.18
0.20
0.22
0.24
0.26
0.28
0.30
0.32
Area Ratio
everolimus
Y = -0.00268891+0.00446137*X R^2 = 0.9973 W: 1/X^2
0
5
10
15
20
25
30
35
40
45
0.00
0.01
0.02
0.03
0.04
0.05
0.06
0.07
0.08
0.09
0.10
0.11
0.12
0.13
0.14
0.15
0.16
0.17
0.18
0.19
0.20
0.21
0.22
0.23
Area Ratio
cyclosporin
0
200
400
600
800
1000 1200 1400 1600 1800
0.0
0.5
1.0
1.5
2.0
2.5
3.0
3.5
4.0
4.5
5.0
Area Ratio
A
C
D
B
Area Ratio
Tab


