
Part of Thermo Fisher Scientific
WWW THERMOSCIENTIFIC COM
Legal Notices: ©2011 Thermo Fisher Scientific Inc. All rights reserved. All trademarks are the property of Thermo Fisher Scientific Inc. and its subsidiaries. This
information is presented as an example of the capabilities of Thermo Fisher Scientific Inc. products. It is not intended to encourage use of these products in any
manners that might infringe the intellectual property rights of others. Specifications, terms and pricing are subject to change. Not all products are available in all
countries. Please consult your local sales representative for details.
In addition to these
offices, Thermo Fisher
Scientific maintains
a network of represen-
tative organizations
throughout the world.
!FRICA /THER
+27 11 570 1840
Australia
+61 3 9757 4300
Austria
+43 1 333 50 34 0
Belgium
+32 53 73 42 41
#ANADA
+1 800 530 8447
#HINA
+86 10 8419 3588
Denmark
+45 70 23 62 60
%UROPE /THER
+43 1 333 50 34 0
Finland/Norway/
Sweden
+46 8 556 468 00
France
+33 1 60 92 48 00
Germany
+49 6103 408 1014
)NDIA
+91 22 6742 9434
)TALY
+39 02 950 591
Japan
+81 45 453 9100
,ATIN !MERICA
+1 561 688 8700
Middle East
+43 1 333 50 34 0
.ETHERLANDS
+31 76 579 55 55
New Zealand
+64 9 980 6700
2USSIA #)3
+43 1 333 50 34 0
3OUTH !FRICA
+27 11 570 1840
Spain
+34 914 845 965
Switzerland
+41 61 716 77 00
UK
+44 1442 233555
USA
+1 800 532 4752
AN63350_E 02/11S
Thermo Fisher Scientific,
San Jose, CA USA is ISO Certified.
Conclusion
A robust 10-minute method for the quantification of
mevalonate with a dynamic range of 2.5 - 250 ng/mL
plasma has been developed for clinical research using
fast SPE purification and the LTQ linear ion trap mass
spectrometer.
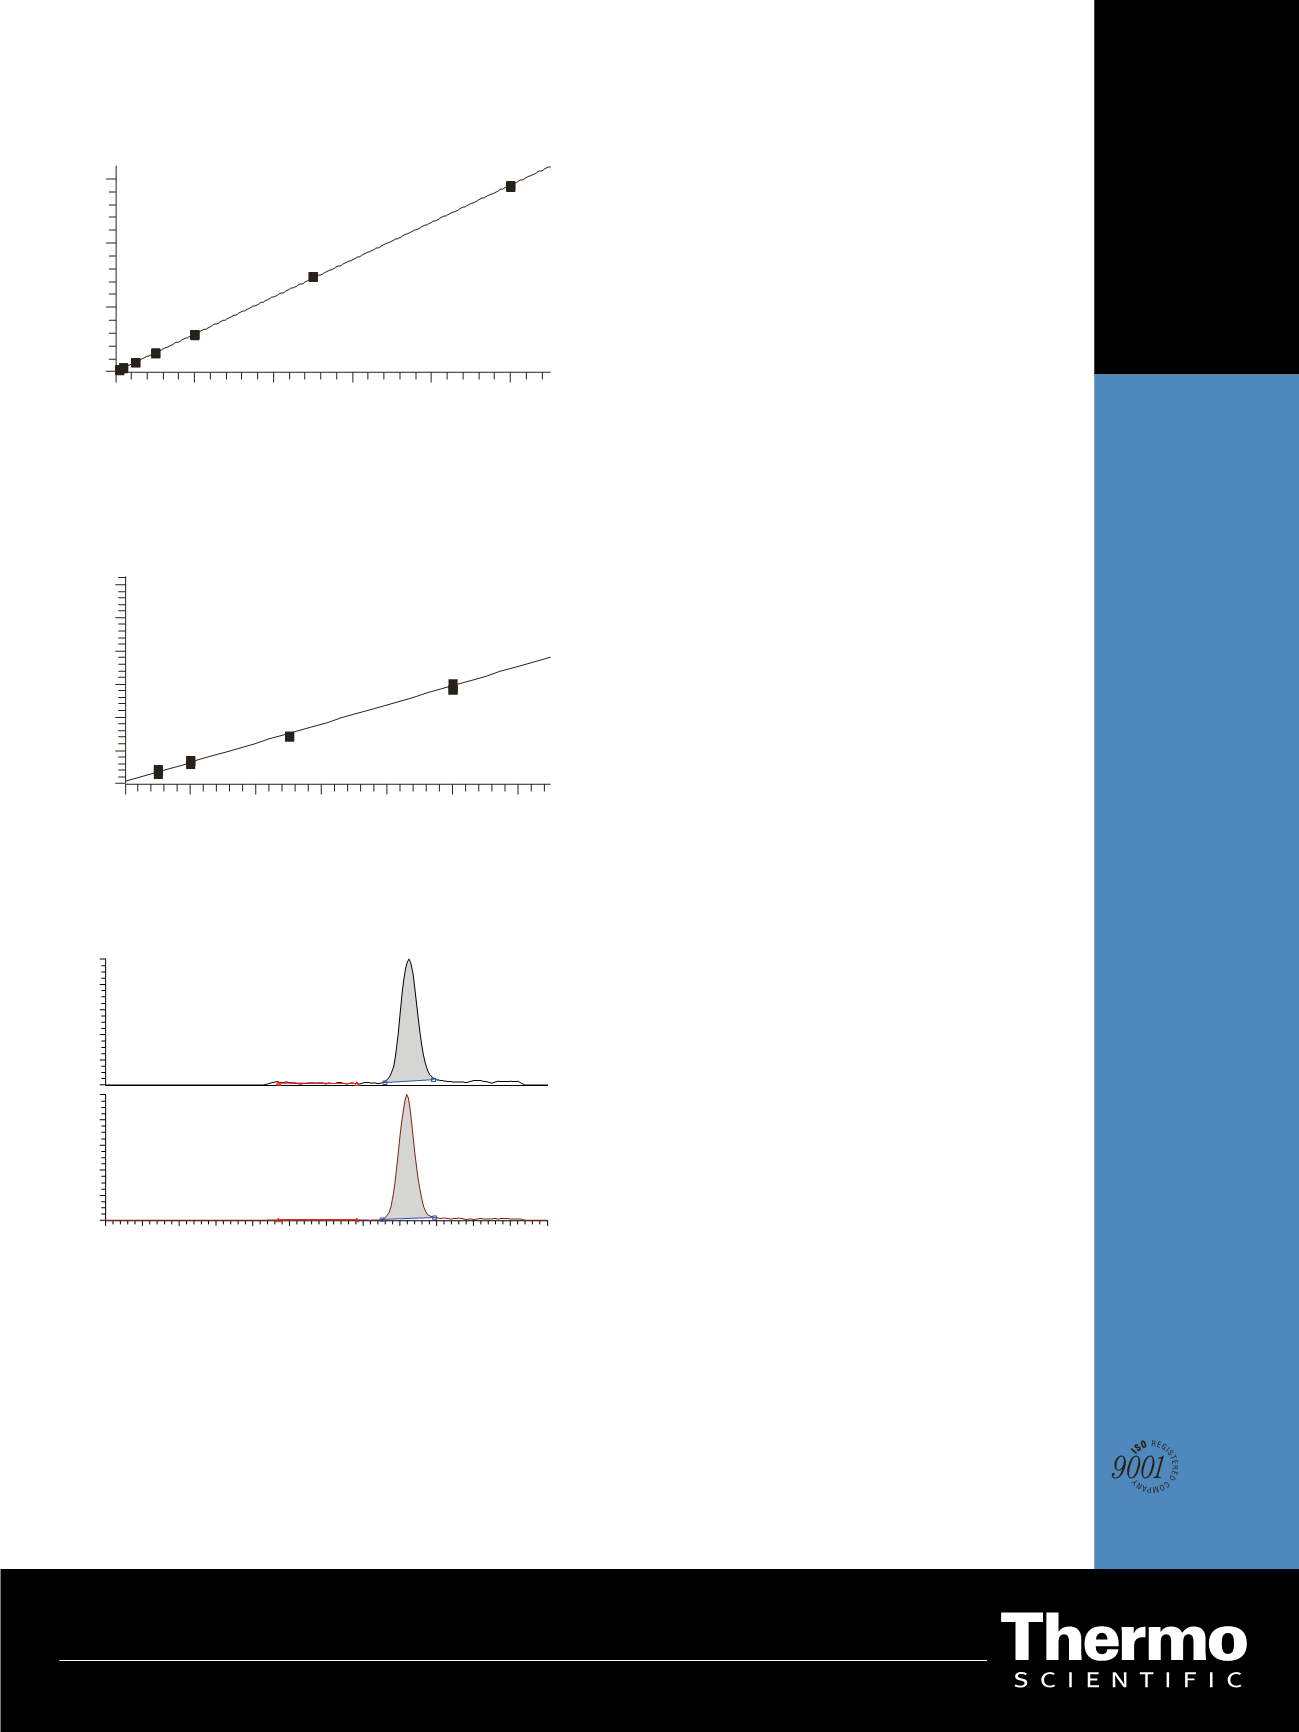
Figure 5. Ion chromatograms of plasma sample containing 24 ng/mL
Mevalonate
Y = 0.00317513+0.00579147*X R^2 = 0.9993 W: 1/X
0
50
100
150
200
250
ng/mL
0.0
0.5
1.0
1.5
Area Ratio
Figure 3. Calibration curve of mevalonate
Mevalonate
Y= 0.00317513+0.00579147*X R^2 = 0.9993 W: 1/X
0
5
10
15
20
25
30
ng/mL
0.00
0.05
0.10
0.15
0.20
0.25
0.30
Area Ratio
Figure 4. Zoom on low calibration points
Mevalonate
Mevalonate-D
7
1.0 1.5 2.0 2.5 3.0 3.5 4.0 4.5 5.0 5.5 6.0 6.5 7.0
Time (min)
0
20
40
60
80
100
RelativeAbundance
0
20
40
60
80
100
RT: 5.12
RT: 5.09


