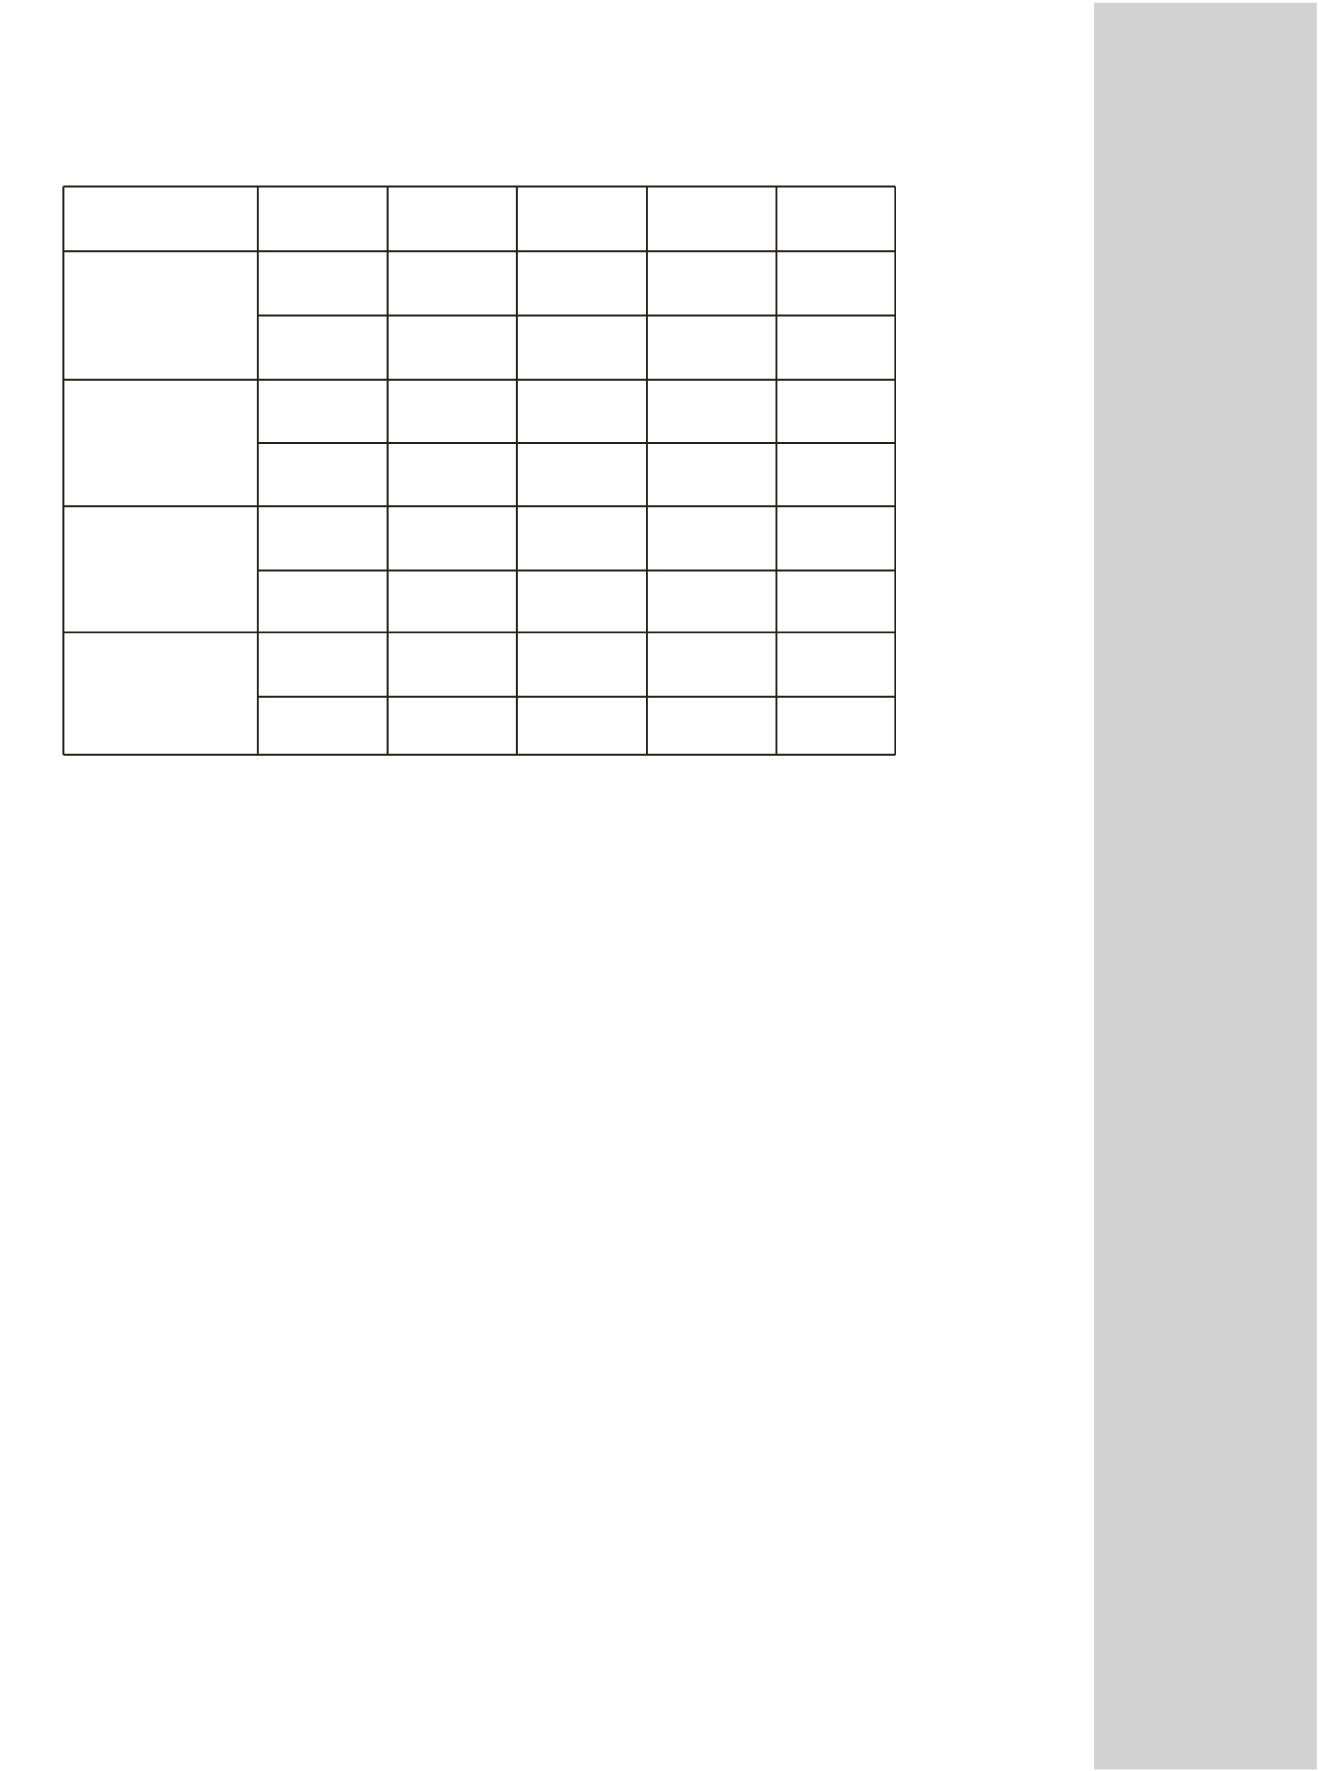

e 1. Method variability for each analyte.
Analyte
Control 1
Control 2
Control 3
Control 4
Tacrolimus
Mean (ng/mL)
1.6
7.4
10.8
20.2
%CV
12.8
4.2
4.2
2.9
Sirolimus
Mean (ng/mL)
3.3
14.4
25.3
41.6
%CV
12.1
5.6
6.5
6.6
Everolimus
Mean (ng/mL)
2.9
13.9
24.2
41.8
%CV
9.4
3.7
4.4
5.5
Cyclosporin
Mean (ng/mL)
83
176
362
787
%CV
8.1
11.1
7.2
4.7
Table 1. Method variability for each analyte
Conclusion
The HRAM analysis using the Exactive mass spectrometer
demonstrates SRM comparable specificity, dynamic range,
LOQ and precision in whole blood matrix. There is good
correlation between SRM and HRAM results for the
immunosuppressant drugs monitored.
The precision of HRAM LC-MS analysis meets
current consensus guidelines and has acceptable perfor-
mance to be used as a candidate clinical research method
following further evaluation. All the method development
time for this application was associated with the sample
preparation and chromatography conditions. The mass
analysis method was established in less than 5 minutes
since there is no requirement to tune SRM transitions,
collision energies or transfer lens voltages.
Acknowledgement
We would like to thank Dr. Mark Harrison for
advice during the method set up.
For Research Use Only.
Not for use in diagnostic procedures.


