
Simultaneous Quantitative Analysis
of Four Immunosuppressive Drugs Using
High Resolution Accurate Mass LC-MS
Neil Leaver
1
, Bevean Chihoho
1
, Helen Welchman
2
, Sarah Robinson
2
1
Royal Brompton & Harefield NHS Foundation Trust, Harefield Hospital, Harefield, UK;
2
Thermo Fisher Scientific, Hemel Hempstead, UK
Introduction
Immunosuppressive drugs have been quantitatively
analyzed by selected reaction monitoring (SRM) analysis
using tandem mass spectrometry for over 10 years in the
clinical research setting. High resolution accurate mass
(HRAM) mass spectrometry offers the same quantitative
performance characteristics with the added benefit of
significantly faster method development. The HRAM
method development time depends only on the sample
preparation and chromatography conditions. In addition,
mass analysis methods can be established rapidly because
there is no requirement to tune SRM transitions, collision
energies, or transfer lens voltages.
Goal
In this preliminary evaluation a set of calibrators, clinical
samples, and QCs are investigated with the analysis of
multiple replicates over the course of 7 days. The current
in-house validated liquid chromatography – tandem mass
spectrometry (LC-MS/MS) method data is directly
compared against the use of HRAM LC-MS data.
Experimental Conditions
Sample Preparation
Commercial calibration
standards in frozen
stabilized whole blood
were sourced from
Chromsystems (München,
Germany). Commercial
quality control material
in stabilized whole blood
was sourced from More
Diagnostics (Los Osos,
CA, USA). All calibrators,
QCs, and whole blood
samples were extracted
using a plate-based solid
phase extraction (SPE)
procedure.
HPLC
Chromatographic separation was accomplished using
a Thermo Scientific Accela U-HPLC system. A Thermo
Scientific AQUASIL C18 column (150 x 2.1 mm, 5 µm)
heated to 50 ºC, was used with an isocratic gradient of
90% MeCN + ammonium acetate (2 mM). For each
sample, 20 µL was injected.
Mass Spectrometry
MS analysis was carried out on a Thermo Scientific
Exactive high performance benchtop mass spectrometer
powered by Orbitrap
TM
technology. Atmospheric pressure
chemical ionization (APCI) was used to generate the
[M+NH
3
]
+
ions for tacrolimus, sirolimus, and everolimus,
and the [M+H]
+
ions for cyclosporin, as well as two internal
standards: ascomycin (for cyclosporin and tacrolimus) and
desmethoxyrapamycin (for sirolimus and everolimus).
The Exactive
TM
mass spectrometer was set to scan at
50 K resolution over the range
m/z
700 – 1300 and was
calibrated once at the start of the 7-day analysis. Data
acquisition and analysis were carried out with Thermo
Scientific LC
quan
software.
Application
Note: 518
Key Words
• Exactive
• Accela U-HPLC
• Therapeutic Drug
Monitoring
• Clinical Research
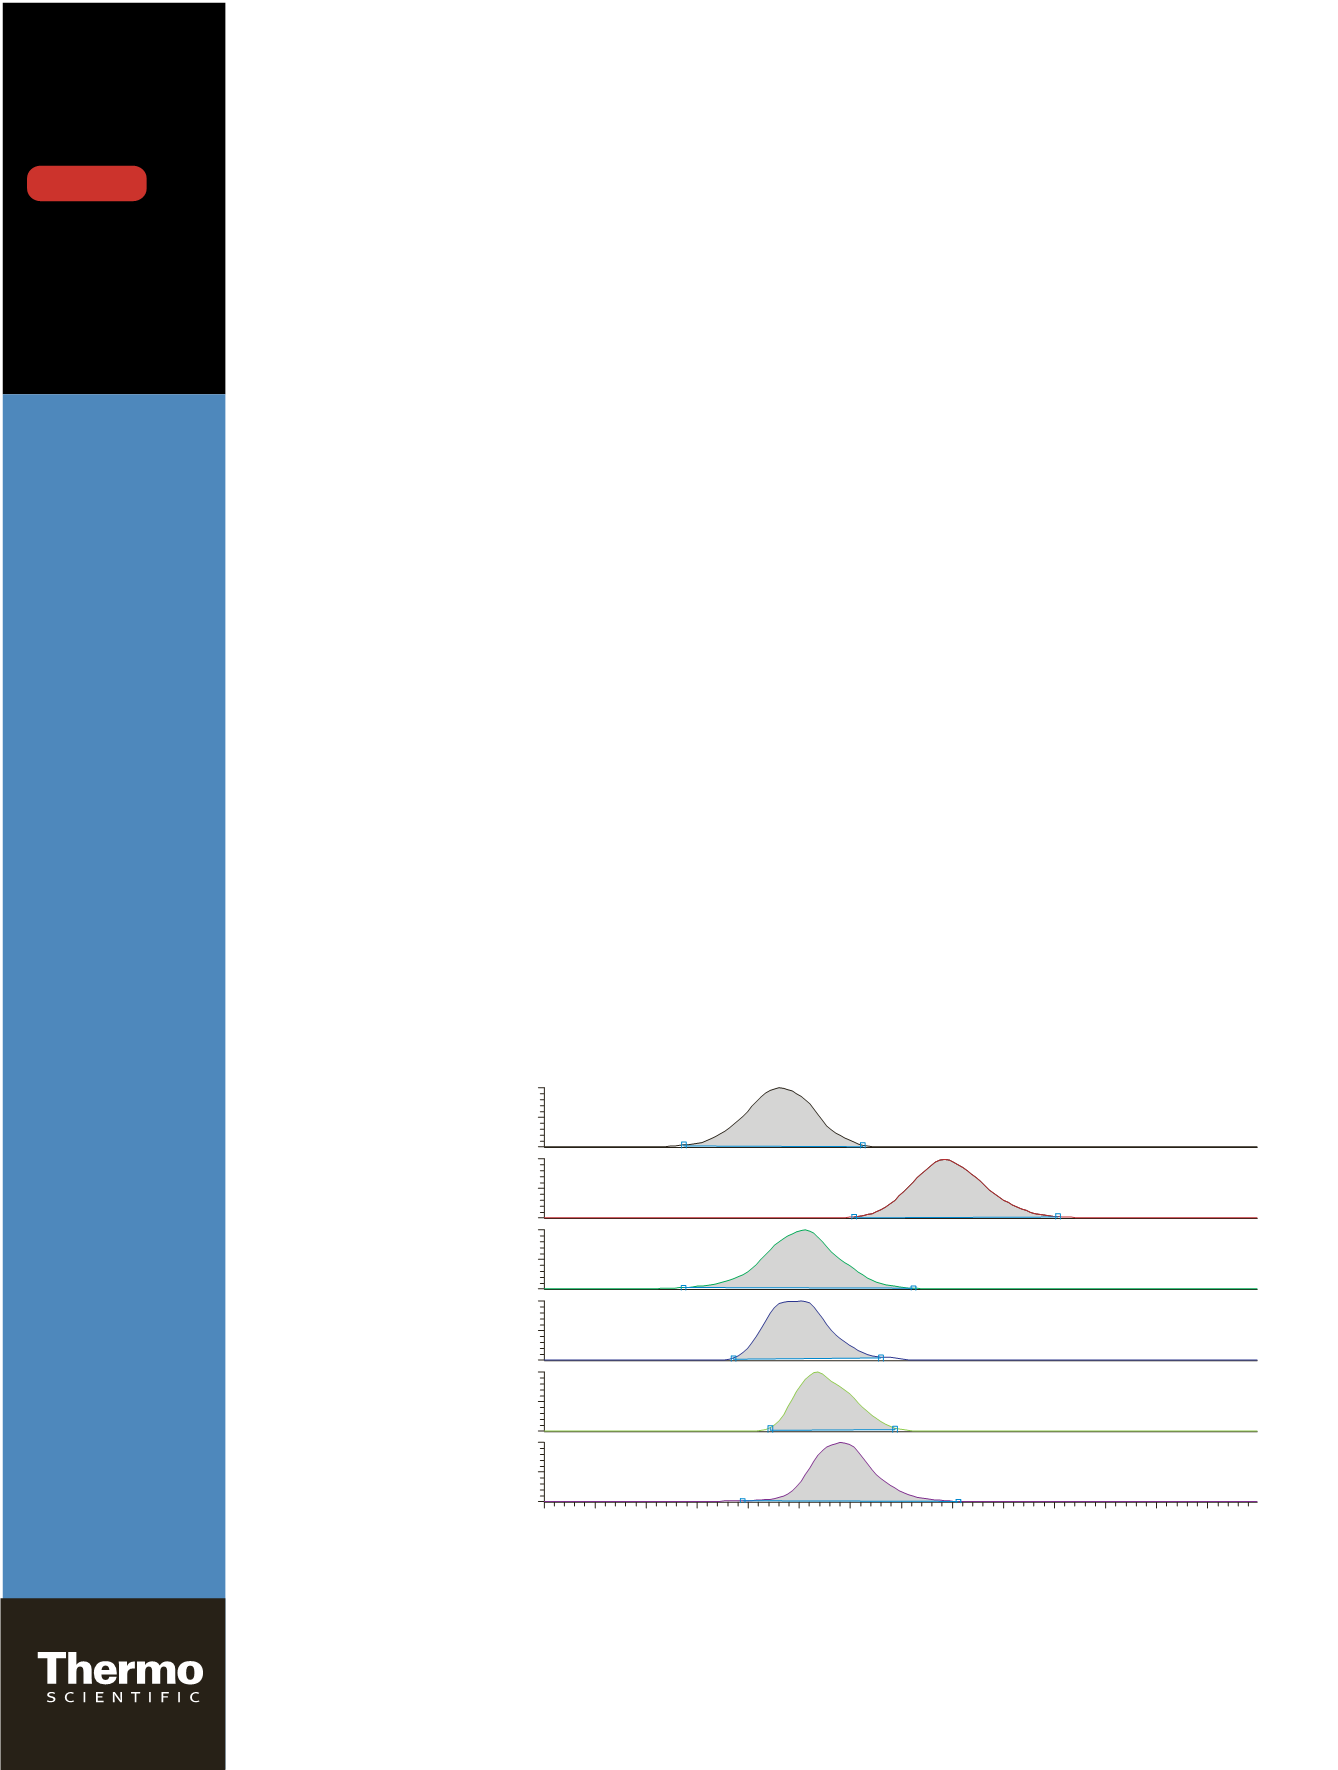
Figure 1. XIC of lowest calibration standard.
C:\ThermoFisherScientific\...\Batch1_01
16/02/2010 17:27:48
Cal1
1.7
1.8
1.9
2.0
2.1
2.2
2.3
2.4
2.5
2.6
2.7
2.8
2.9
3.0
Time (min)
0
50
100
0
50
100
0
50
100
0
50
100
Relative Abundance
0
50
100
0
50
100
RT: 2.16
RT: 2.48
RT: 2.21
RT: 2.20
RT: 2.24
RT: 2.29
Tacrolimus
m/z
821.5160
Cyclosporin
m/z
1202.8509
Ascomycin
m/z
809.5171
(internal standard)
Sirolimus
m/z
931.5907
Everolimus
m/z
975.6172
Desmethoxyrapamycin
m/z
901.5797
(internal standard)
RT:
1.70 - 3.10
SM:
11G
Figure 1. XIC of lowest calibration standard
DOWNLOAD


