
Results
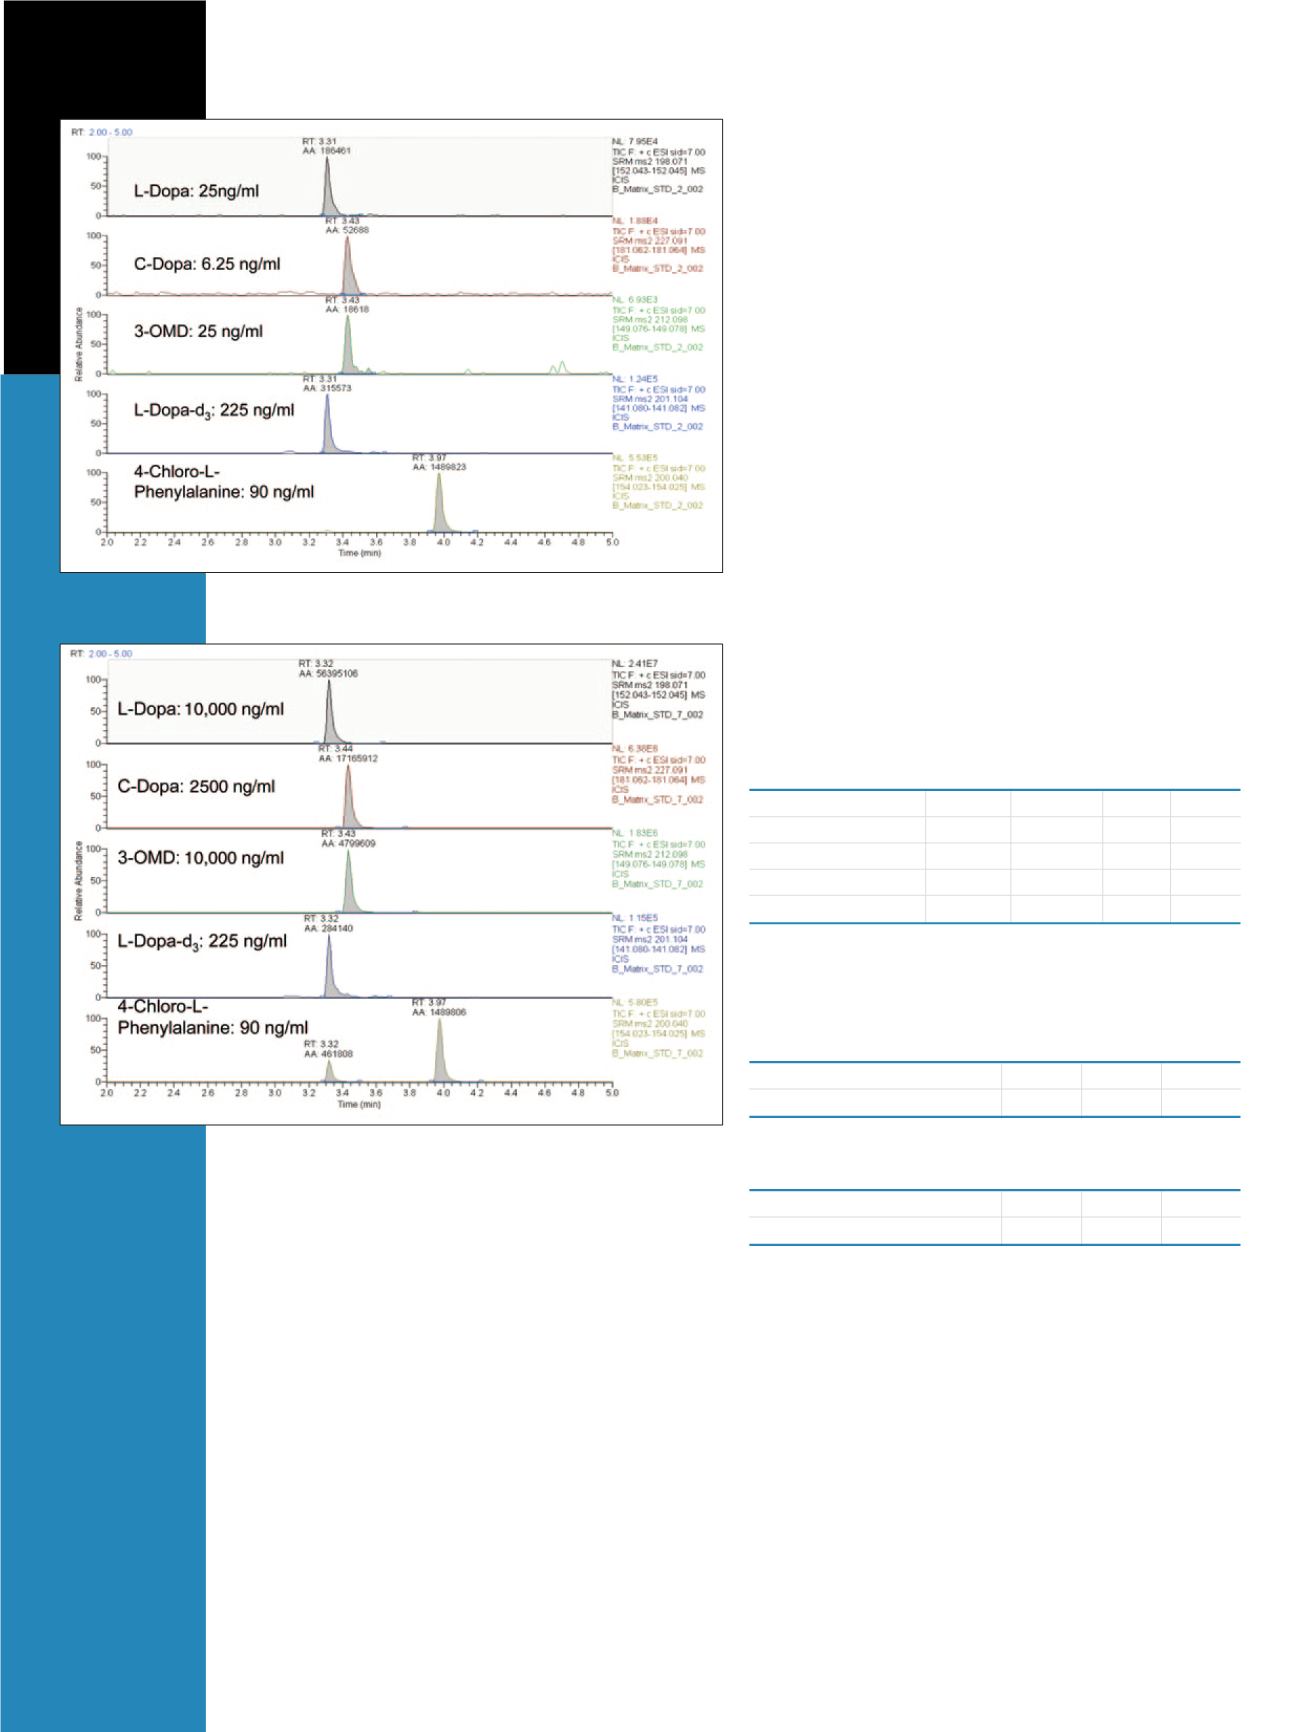
Figures 1 shows a representative chromatogram for the
assay at the low end of the curve. Figure 2 shows a
representative chromatogram for the assay at the high end
of the curve. Linearity of the calibration curves (N=3)
ranged from 0.9942 to 0.9989 (with 1/x weighting).
Figure 3 shows the representative linear calibration curves
for all three test compounds. The excellent linear fits were
over the range of 100-10000 ng/mL for L-Dopa and
3-OMD and 25-2500 ng/mL for C-Dopa. The limit of
detection (LOD) levels were five-times lower for all
compounds. The % CV values were less than 20%
deviation for LLOQ and less than 15% deviation for all
the other points on the calibration curve. Carryover was
determined to be much less than 20% of lower limit of
quantitation (LLOQ). A minimum of 85% recovery was
achieved. The variability was determined by processing
and analyzing five replicates of each of four QC samples.
The test was repeated in three batches, Table 2. The results
show that the %RSDs were well below the validation
guideline of 15%.
1
Figure 1: The representative chromatogram for the assay at the low end of
the calibration curve
Figure 2: The representative chromatogram for the assay at the high end of
the calibration curve
Table 2: Low internal standard variability demonstrated the reliability of
the method
L-Dopa-d
3
in QC Samples
Batch #1
Batch #2 Batch #3
Number of Samples
20
20
20
RSD (%)
6.2
6.6
4.7
4-Chloro-L-Phenylalanine in QC Samples
Batch #1
Batch #2 Batch #3
Number of Samples
20
20
20
RSD (%)
2.0
1.6
2.3
Table 1: Positive single reaction mode (+SRM) transitions and other MS
parameters for test compounds
Parent
Fragment
Collision Tube Lens
Compound
Ion
Ion
Energy (eV) Offset
L-DOPA
198.071
152.044
14
72
C-DOPA
227.091
181.063
12
77
3-OMD
212.098
149.077
15
75
L-DOPA-d
3
201.104
141.081
16
87
4-Chloro-L-Phenyl-Alanine 200.040
154.024
14
61


