
Results and Discussion
Plasma was centrifuged prior to
analysis. Calibration standards were
analyzed from low to high concentration
followed by IQCs. An injection of
solvent after the highest concentration
IQC was used for evaluation of carry-
over. The volume of plasma injected
was 10 µL, and all plasma analyses
were in triplicate.
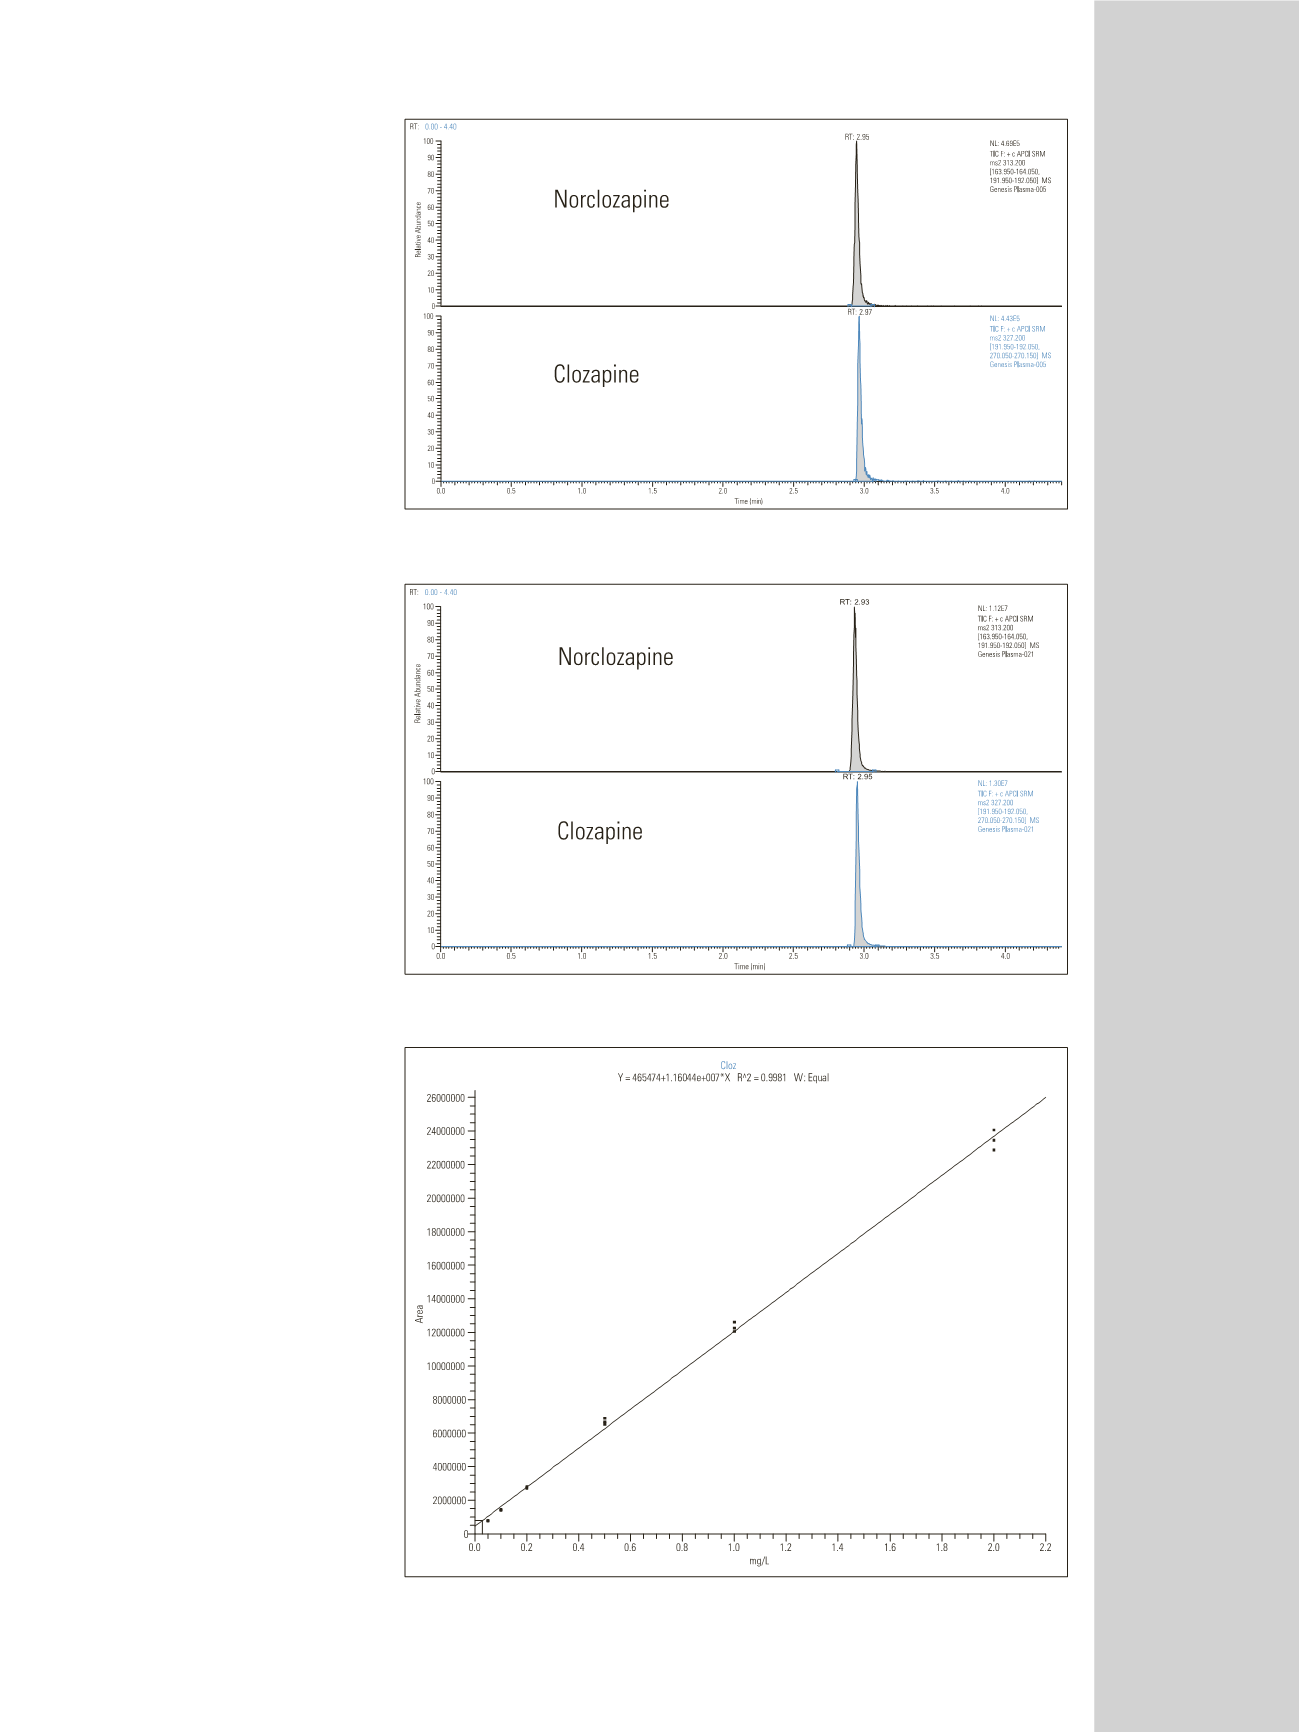
The extracted ion chromatograms
of the plasma blank and lowest and
highest concentration calibrators
are presented in Figures 2, 3, and 4,
respectively. The calibration curves for
clozapine and norclozapine covered the
range 0.05- 2.00 mg/L (Figure 5 and 6).
No internal standard was used, and
thus, this work demonstrates the
reproducibility of the system using
external standard calibration.
Reproducibility and variance of
the calibrators are shown in Figure 7.
Carry-over was calculated by
comparing the response for clozapine
and for norclozapine with that of a
solvent blank injected immediately
after a 1.2 mg/L IQC sample. This
was shown to be ~0.1% for both
clozapine and norclozapine.
Additional clozapine metabolites were
not investigated as part of this
evaluation.
Conclusion
The research use of TurboFlow
technology for automated sample
preparation and tandem MS detection
allowed the selective analysis of
clozapine and norclozapine in
plasma. The only sample preparation
was the centrifugation of plasma. The
sample volume required was one-
tenth that used by the existing
method – liquid-liquid extraction
(LLE) followed by HPLC-UV – and
provided lower limits of detection and
quantitation. The calibration curves
for all analytes were linear over the
concentration range and carry-over
was minimal. Use of the automated
TurboFlow method has effectively
eliminated two hours of sample
preparation time for a 100-sample
batch.
Figure 3: Clozapine and Norcloxapine lowest calibration from plasma, 0.05 mg/L
Figure 4: Clozapine and norcloxapine lowest calibration from plasma, 2 mg/L
Figure 5: Clozapine calibration curve, 0.05 – 2 mg/L


