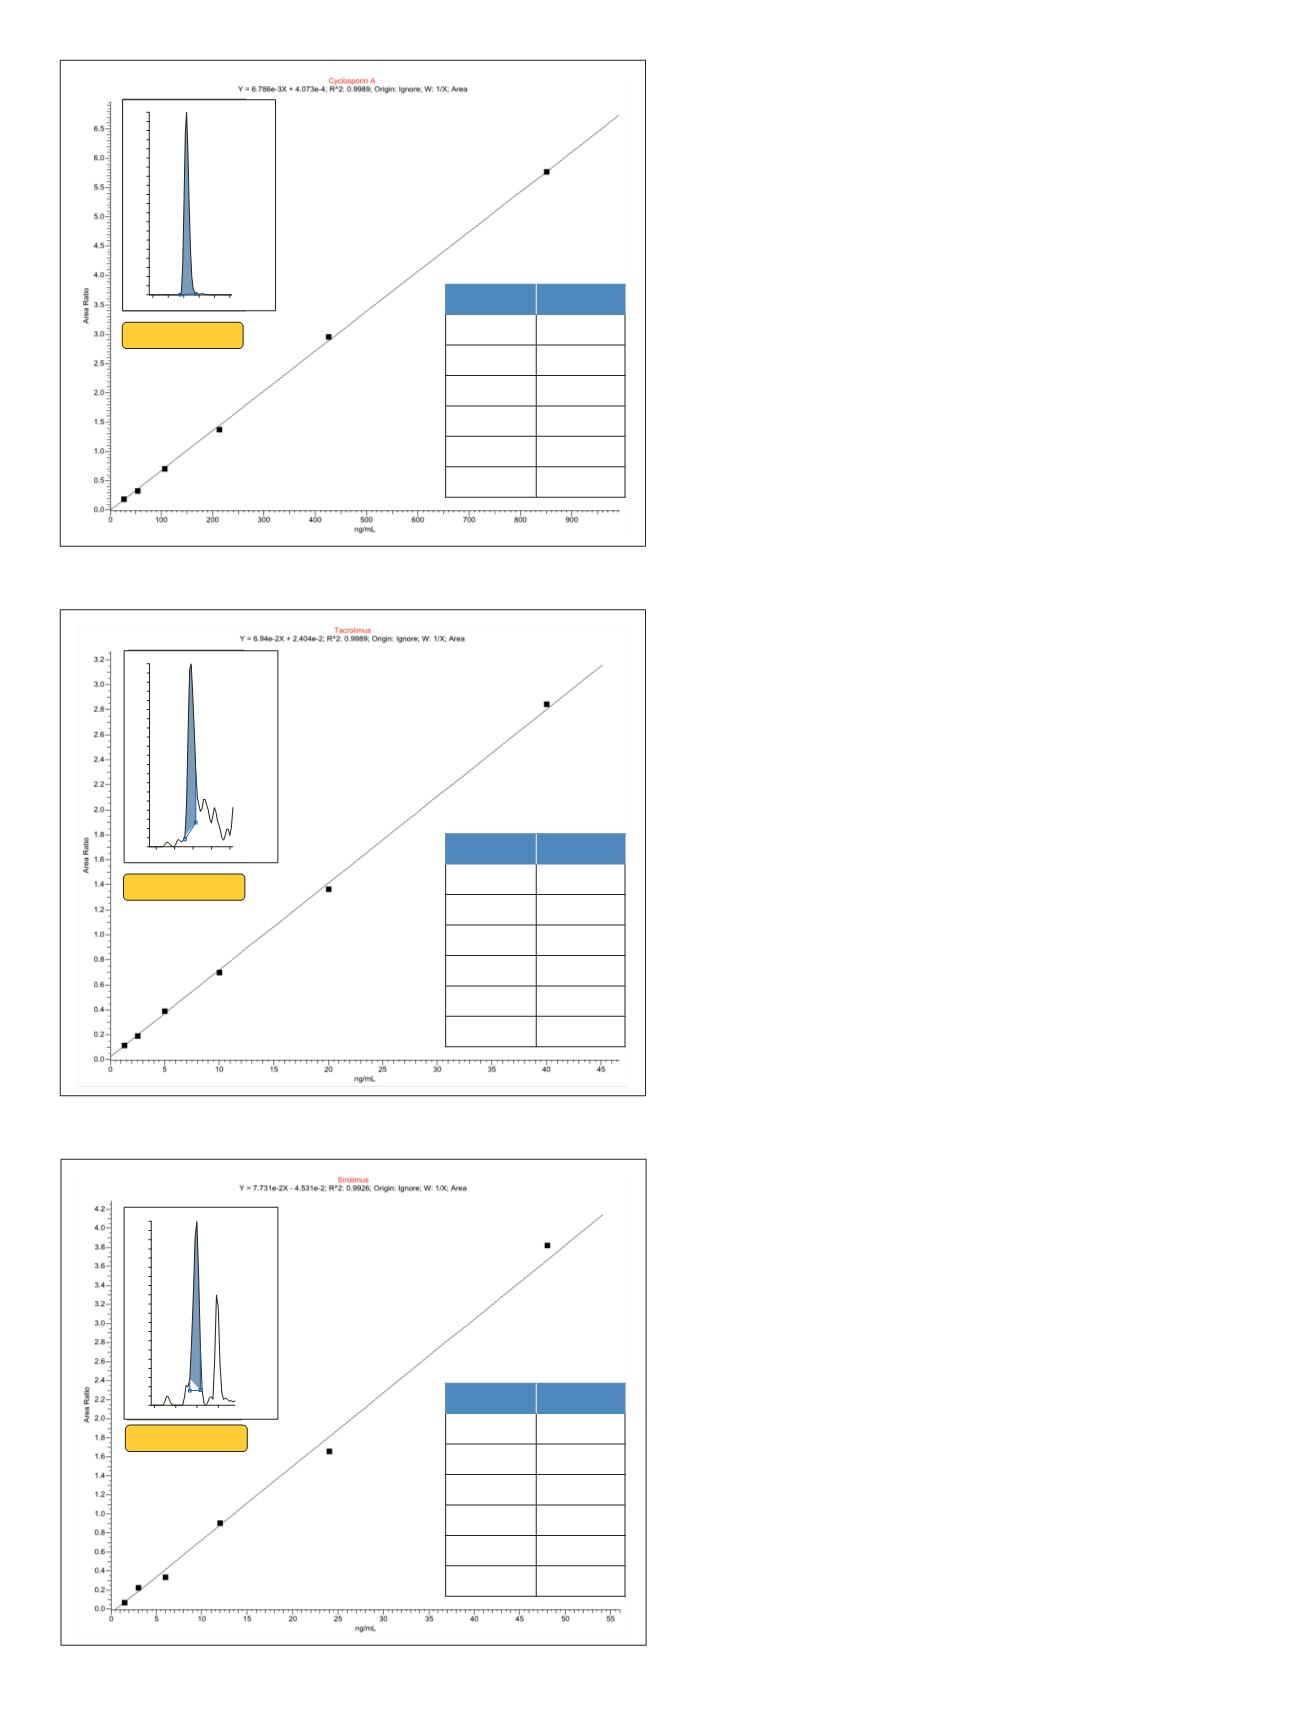

3
26 ng /mL
ng/mL % Diff
26
10.9
53
-8.5
106
-0.9
212
-4.3
425
2.6
850
0.1
Figure 2. Cyclosporin A
1.3 ng/mL
ng/mL % Diff
1.3
1.7
2.5
-3.8
5.0
5.8
10
-2.5
20
-3.2
40
1.7
Figure 3. Tacrolimus
1.5 ng/mL
ng/mL % Diff
1.5
0.4
3
17.3
6
-16.6
12
2.5
24
-7.9
48
4.3
Figure 4. Sirolimus
RT:
0.58 -1.11
0.6 0.7 0.8 0.9 1.0 1.1
Time (min)
0
5
10
15
20
25
30
35
40
45
50
55
60
65
70
75
80
85
90
95
100
RelativeAbundance
RT:0.82
NL:3.31E3
TICF:+ cESISRM
ms21220.00
[1202.80] MS ICIS
SCH_Immunosuppres
ants_STD_level1_001
RT:
0.56 -1.02
0.6
0.7
0.8
0.9
1.0
Time (min)
0
5
10
15
20
25
30
35
40
45
50
55
60
65
70
75
80
85
90
95
100
RelativeAbundance
RT:0.79
NL:2.30E2
TICF:+ cESISRM
ms2821.60 [768.45]
MS ICIS
SCH_Immunosuppres
ants_STD_level1_001
RT:
0.58 -0.98
0.6
0.7
0.8
0.9
Time (min)
0
5
10
15
20
25
30
35
40
45
50
55
60
65
70
75
80
85
90
95
100
RelativeAbundance
RT:0.80
NL:2.69E1
TICF:+ cESISRM
ms2931.85 [864.50]
MS ICIS
SCH_Immunosuppres
ants_STD_level1_001


