
3
0.0
0.1
0.2
0.3
0.4
0.5
0.6
0.7
0.8
0.9
1.0
1.1
1.2
1.3
1.4
1.5
1.6
Time (min)
0
20
40
60
80
100
0
20
40
60
80
100
0
20
40
60
80
100
RelativeAbundance
0
20
40
60
80
100
Tacrolimus
Sirolimus
Everolimus
Cyclosporine A
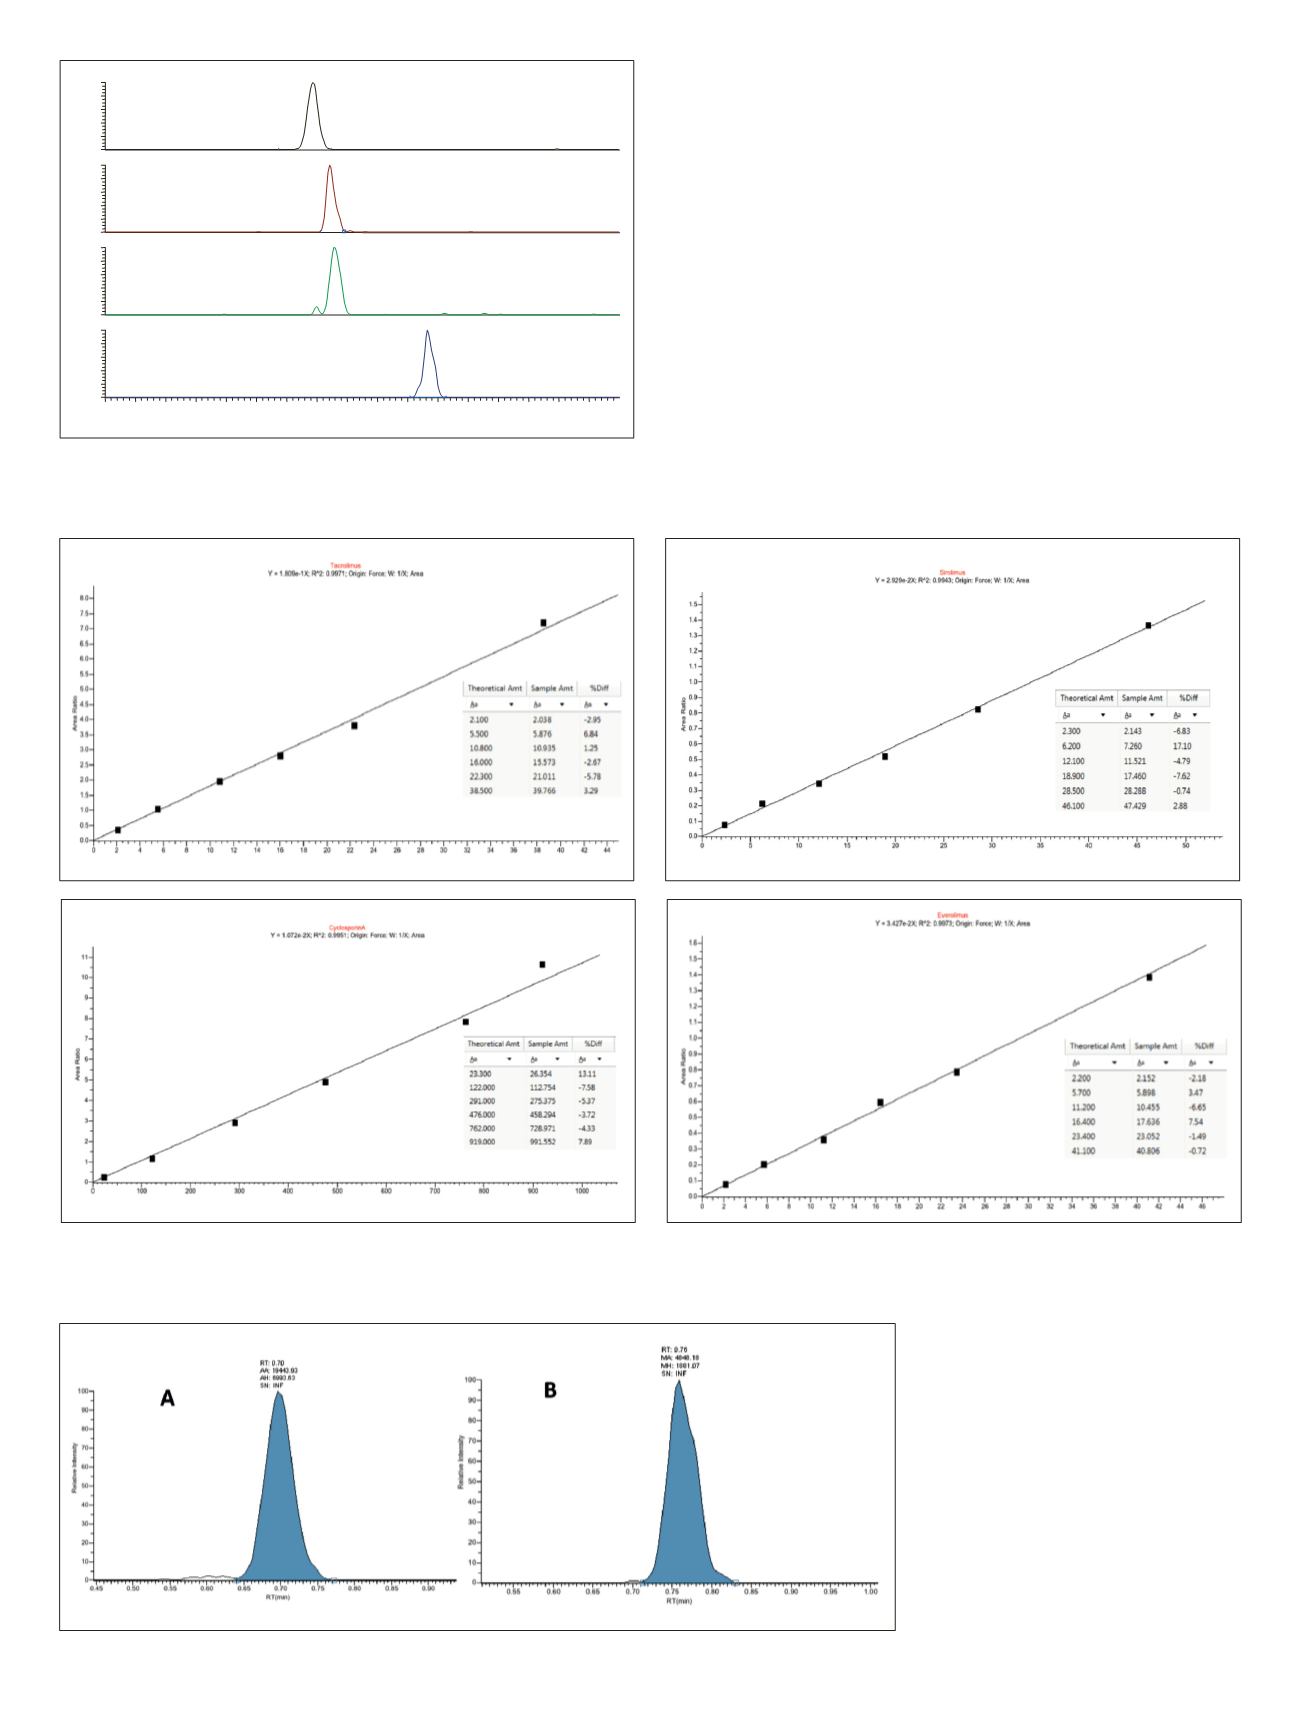
Figure 2. Chromatograms of the calibration standard at the lowest level
Figure 3. Calibration curves of all four ISD drugs
Figure 4. A: Chromatogram of tacrolimus
quantifying peak from a donor at a
calculated concentration of 13.6 ng/mL
in whole blood (15.1 ng/mL reported
from immunoassay); B: Chromatogram of
sirolimus quantifying peak from a donor at
a calculated concentration of 22.3 ng/mL
in whole blood (22.4 ng/mL reported from
immunoassay).


